How to Increase Your Conversion Rate: Proven Tactics by Funnel Stage
Learn how to increase your conversion rate with actionable tactics organized by funnel stage. Benchmarks, product page tips, checkout fixes, and AI-powered strategies.

What is a good conversion rate?
A good ecommerce conversion rate depends on your industry, traffic source, and device mix. The global average sits around 1.5-2.5%, but that number hides enormous variation. A food and beverage store converting at 2% is underperforming. An electronics shop at the same rate is doing well.
The most reliable benchmarks come from live transaction data, not surveys. IRP Commerce tracks real ecommerce transactions monthly and reports a global average of 1.56% for February 2026, fluctuating between 1.56% and 2.12% throughout 2025. Dynamic Yield's XP2 benchmark tool provides industry-specific breakdowns based on rolling 12-month data.
| Industry | Average Conversion Rate | Source |
|---|---|---|
| Food & Beverage | ~6.0% | Dynamic Yield |
| Beauty & Personal Care | ~4.5-5.7% | Dynamic Yield |
| Fashion & Apparel | ~3.1% | Dynamic Yield |
| Multi-Brand Retail | ~3.0-4.0% | Dynamic Yield |
| Consumer Electronics | ~1.4% | Dynamic Yield |
| Luxury & Jewelry | ~0.9% | Dynamic Yield |
| All Industries Average | ~1.56% (Feb 2026) | IRP Commerce |
Device matters just as much as industry. Desktop converts at roughly 3.9%, while mobile sits between 1.8% and 2.9%, according to Smart Insights (2025). Mobile drives about 75% of all ecommerce traffic but only 57% of completed purchases. That gap represents the single biggest revenue opportunity for most online stores.
Traffic source also changes the picture. Organic search visitors typically convert 2-3x higher than social media traffic, because search intent is stronger. Paid ads fall somewhere in between, depending on targeting quality. Before benchmarking, filter your data by these three dimensions: industry, device, and traffic source.
What influences your conversion rate?
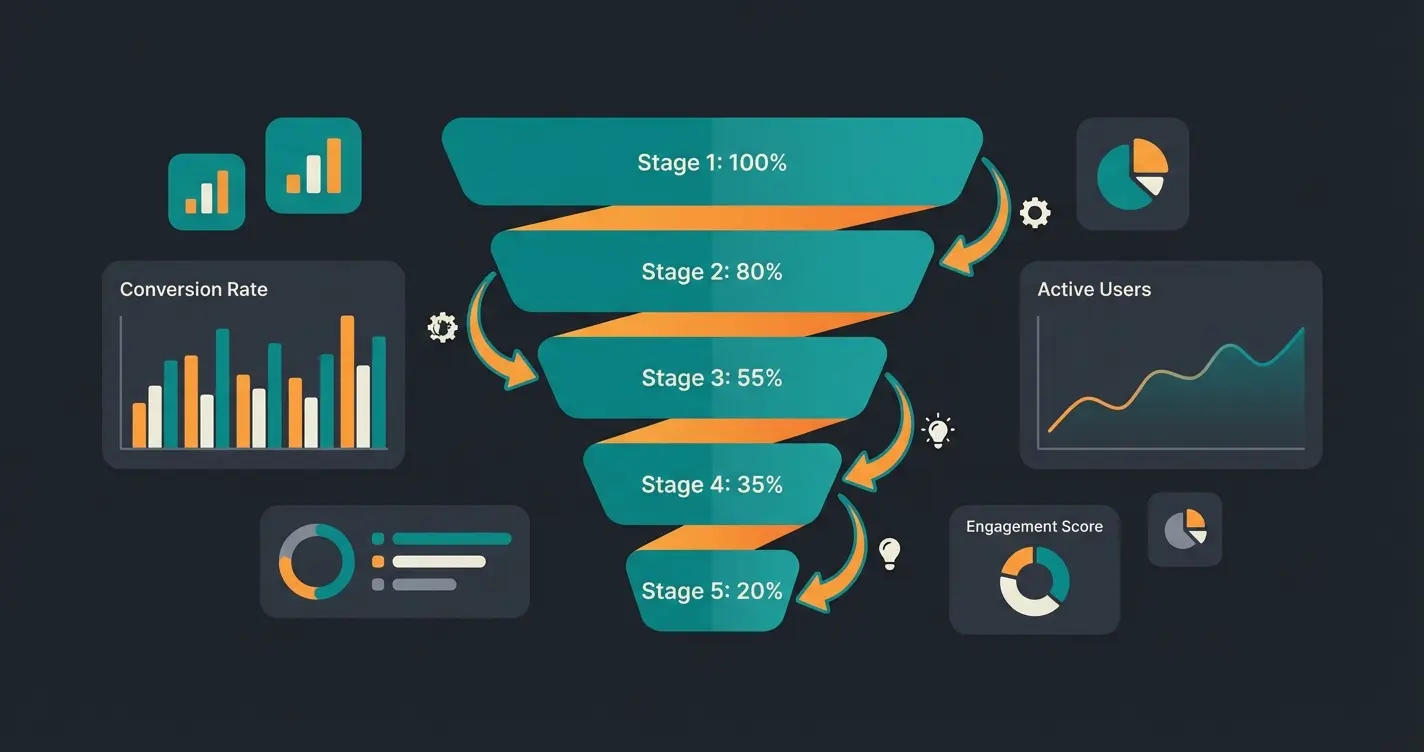
Every purchase follows a funnel. Visitors land, browse, evaluate, add to cart, and check out. At each stage, a percentage drops off. The key insight most guides miss: you need to diagnose where the drop-off happens before picking tactics. A store losing visitors at the product page needs different fixes than one bleeding customers at checkout.
I have seen store owners spend months optimizing their checkout when their real problem was on the product page. Or investing in paid traffic when their landing page loaded in six seconds. The funnel framework below forces you to work on the right problem first.
Are the right visitors arriving? Paid ads, organic search, and referrals bring different intent levels. Low-intent traffic will never convert well, no matter how good your store is.
Page speed, design, and relevance. 53% of mobile users leave if a page takes over 3 seconds to load (Google). Your first impression window is under two seconds.
Can visitors find what they need? Search, filters, guided selling, and product recommendations. Most stores underinvest here.
Images, descriptions, reviews, and social proof. Products with 5+ reviews are 270% more likely to sell (Spiegel Research Center, Northwestern).
70.19% of carts are abandoned (Baymard Institute, 49 studies). Transparent pricing, guest checkout, and the right payment methods reduce this significantly.
Repeat buyers convert at 60-70% vs 1-3% for new visitors. Retention is the cheapest conversion lever you are probably ignoring.
The rest of this guide walks through each stage with specific tactics and expected impact. For a broader framework on Shopware Conversion Optimization, see our pillar guide which covers the strategic methodology behind these tactics. Shopware also provides a useful overview of CRO fundamentals for their platform.
Product page and purchase decision
The product page is where intent becomes action. Or does not. I have reviewed hundreds of product pages across our client base, and the same patterns keep showing up. Stores with strong product pages convert 2-3x better than those with basic listings, even with identical products and traffic volumes.
The difference is rarely one single element. It is the combination of visual quality, information completeness, and trust signals working together. Here are the tactics ranked by typical impact.
- High-quality product images. Multiple angles, zoom capability, and video where possible. 360-degree views increase conversion by 10-40% in consulting-intensive categories. For products where fit, texture, or scale matter, video outperforms static images consistently.
- Descriptions that answer buying questions. Not feature dumps. Address the three questions every buyer has: Will this solve my problem? Is this the right size or version for me? What happens if it does not work? Structure descriptions around these questions, not around product specs.
- Social proof above the fold. Star ratings and review count visible without scrolling. Products with 5+ reviews are 270% more likely to be purchased than products with zero reviews (Spiegel Research Center, Northwestern University). A PowerReviews study confirmed a 76.7% conversion lift when shoppers see at least one review.
- Product recommendations and [cross-selling strategies](/blog/shopware-cross-selling). Relevant suggestions increase average order value by 10-30%. The key word is relevant. Generic "customers also bought" performs 3-5x worse than personalized recommendations based on actual behavior and product compatibility.
- Urgency that is honest. Real stock levels, real delivery timelines, seasonal deadlines. Fake scarcity destroys trust faster than it creates it. Show actual remaining inventory, not artificial countdown timers.
Expected impact: +10-30% conversion rate improvement on the product page stage. For a deep dive into specific product page elements, see our guide on how to optimize your product pages.
Trust and social proof
Trust is not a feature you add. It is a signal you earn and display. But the way you display those signals matters enormously for conversion, especially in European e-commerce where shoppers are more cautious than in the US market.
German and Austrian shoppers expect recognized payment providers, visible return policies, and GDPR compliance before they commit. Missing even one of these signals can cost you the sale, regardless of how good your product is.
- Trust badges and security certificates. Trusted Shops, TUV, SSL lock icon. Place them near the add-to-cart button, not buried in the footer. Positioning matters: badges placed within the purchase flow convert better than badges placed elsewhere on the page.
- Payment method logos. Show all accepted methods early, ideally on the product page. In DACH markets, PayPal, Klarna, and Sofort are expected by default. Missing payment logos signal an unprofessional operation.
- Clear return policy. State it on the product page, not just in the terms. A 30-day money-back guarantee removes the biggest remaining objection for undecided buyers. Make the policy visible, not just technically accessible.
- Customer reviews with photos. User-generated content outperforms brand photography for trust. Even imperfect reviews build credibility. Stores with photo reviews see 15-25% higher conversion than those with text-only reviews.
- Real contact information. Phone number, physical address, response times. For SMEs competing against marketplaces, this signals legitimacy more effectively than any badge or certificate.
For a complete breakdown of which trust elements and badges perform best by industry and placement, see our dedicated guide.
Cart abandonment reduction
Here is the number that should keep every store owner up at night: 70.19%. That is the average cart abandonment rate across 49 published studies, according to Baymard Institute (updated 2026). Seven out of ten shoppers who add something to their cart never complete the purchase.
The top reason is not indecision. 48% of shoppers abandon because of unexpected extra costs revealed at checkout: shipping fees, taxes, handling charges. The fix is obvious but still ignored by most stores. Show total costs early. The second most common reason is forced account creation, accounting for another 26% of abandonments.
- Show shipping costs on the product page. Not at checkout. Not in a tooltip. On the page, near the price. This single change can reduce abandonment by 10-15%. Pair it with a free shipping threshold ("Free shipping over EUR 50") to increase average order value simultaneously.
- Offer guest checkout. Forced account creation is the second most common abandonment reason at 26%. Let people buy first, offer account creation on the confirmation page with a single-click option.
- Progress indicator. Show shoppers where they are in the checkout process. Three steps maximum. Uncertainty about how long checkout will take causes 5-10% of abandonments.
- Exit-intent offers. A well-timed popup with free shipping or a small discount recovers 5-10% of abandoning visitors. Use sparingly. One trigger per session, not per page.
- Abandoned cart emails. Send the first within one hour. Include the product image, price, and a direct link back to the cart. Three-email sequences (1 hour, 24 hours, 72 hours) recover 5-15% of abandoned carts.
- Persistent carts across devices. Many shoppers research on mobile and buy on desktop. If the cart resets between sessions or devices, you lose sales from customers who already decided to buy.
Expected impact: -15-25% cart abandonment rate. For the full playbook on recovery tactics, see our Shopware Cart Abandonment guide.
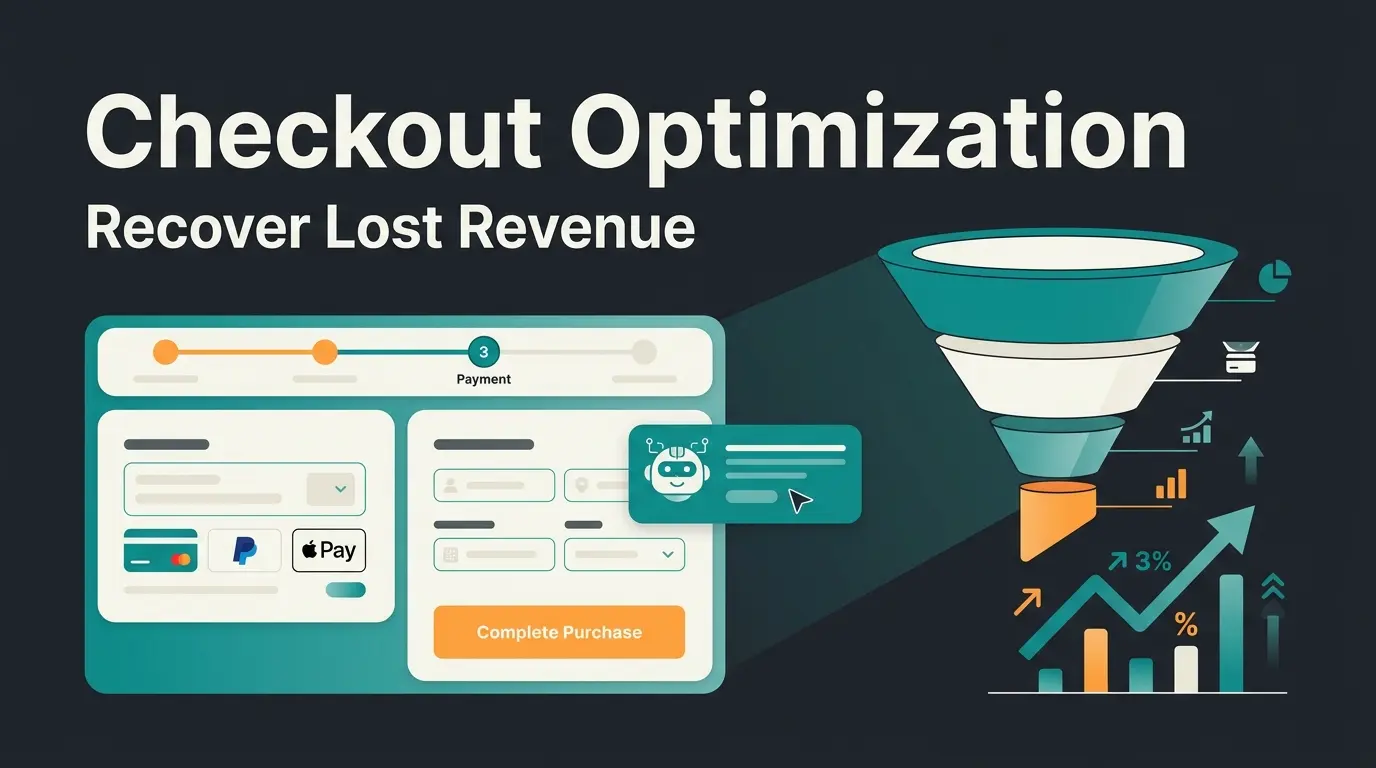
Checkout and payment optimization
The checkout is the final bottleneck. By the time a customer reaches this stage, they have already decided to buy. Your only job is to not get in the way. Every extra form field, every missing payment method, every confusing layout costs you completed orders.
Mobile checkout deserves special attention. Mobile checkout abandonment runs at 77.2%, far above the desktop rate. The reason is almost always friction: tiny form fields, missing auto-fill, and payment methods that require typing long card numbers on a small screen.
- Minimize form fields. Every field you remove increases completion rates. Ask only for what you need to fulfill the order. Name, address, payment. That is it. Auto-detect city from postal code. Skip the "confirm email" field.
- Offer the right payment methods. In DACH markets: PayPal, Klarna (buy now, pay later), credit card, Sofort, Apple Pay, Google Pay. Baymard found that missing a preferred payment method causes 9% of all checkout abandonments.
- One-page checkout. Consolidate the process into a single scrollable page. Multi-step checkouts with unclear navigation lose 2-5% of customers at each transition step.
- Auto-fill and address validation. Reduce friction and errors by leveraging browser auto-fill capabilities. Mobile shoppers especially benefit from auto-complete, reducing form completion time by 40-60%.
- Express checkout options. PayPal Express, Apple Pay, Shop Pay. One-click purchasing for returning customers reduces checkout time by 60-80% and removes the most common drop-off point entirely.
- Mobile-first form design. Large tap targets (minimum 44px), numeric keyboards for phone and postal code fields, inline validation that catches errors immediately. Do not let users submit a form only to see errors at the top of the page.
For a step-by-step implementation guide with platform-specific instructions, learn how to optimize your checkout with our detailed guide.
AI-powered conversion optimization
This is where most conversion guides stop. They cover the basics, recommend A/B testing, and call it done. But the biggest conversion gains we see across our client base come from a layer that most stores have not implemented yet: AI-powered product advisory.
The premise is simple. Most online stores expect customers to navigate a catalog on their own. Compare products, read descriptions, figure out compatibility. In a physical store, a salesperson would do this for you. An AI team member brings that same experience online, at scale, around the clock.
According to McKinsey, personalization drives a 10-15% revenue lift on average. But there is a meaningful difference between basic personalization (showing recently viewed items) and intelligent product advisory (understanding what a customer actually needs and guiding them to the right product).
- AI product advisory and guided selling. Instead of browsing through hundreds of products, a customer describes their situation and gets a tailored recommendation within seconds. This works especially well for consulting-intensive products: garden care, nutrition, technical equipment. Our client Rasendoktor saw a 16x ROI and 100% automation of webchat inquiries after implementing AI-powered product advisory with Qualimero.
- Personalized browsing experiences. AI that learns from behavior and adjusts product sorting, recommendations, and content in real time. Unlike rule-based systems, machine learning models improve continuously. See our guide on AI personalization for implementation details.
- Intelligent product finder and guided selling tools. Interactive systems that ask the right questions and narrow down the product catalog. Particularly effective when the product range exceeds 500 items and customers cannot easily self-navigate.
- Automated customer support that reduces purchase hesitation. Purchase hesitation is often caused by unanswered questions: Does this fit? Is it compatible? When will it arrive? When an AI team member can answer product questions instantly, at any time, in any language, the checkout rate increases. We see a +60% checkout rate improvement across our client base.
- Predictive analytics for proactive optimization. Identifying which visitors are likely to buy and optimizing their experience in real time. Which products to show, what content to highlight, when to offer support. This shifts CRO from reactive (fixing problems after they happen) to proactive.
Our clients see a +35% increase in cart value and +60% higher checkout rates with an AI team member. No flow builders, no programming, no ticket systems.
Book a demoMeasure, test, optimize
Tactics without measurement are guesswork. Before you implement any of the strategies above, set up your tracking foundation. Without data, you cannot identify where the funnel breaks, and you cannot measure whether your changes actually work.
The most common mistake I see: stores implement five changes at once, see a conversion increase, and have no idea which change caused it. Or worse, three changes helped and two hurt, and the net result looks like nothing happened.
- Set up funnel tracking in GA4. Configure ecommerce events from page view through purchase. Map every step and measure the drop-off between each. This tells you where to focus, not guess.
- Use heatmaps and session recordings. Hotjar or similar tools show you exactly where visitors click, scroll, and leave. Quantitative data tells you where they drop off. Qualitative data tells you why.
- Form a specific hypothesis. Based on the data, identify the biggest drop-off point and hypothesize a fix. Not "let us try a new button color" but "67% of mobile users leave at the shipping cost reveal, so let us show shipping costs on the product page."
- A/B test before you commit. Run changes against the current version until you reach statistical significance. Most tests need 1,000-5,000 visitors per variant to be reliable. Our A/B testing guide covers methodology and tool recommendations.
- Iterate continuously. CRO is not a project with an end date. It is a process. The best-converting stores test continuously, running 2-3 experiments per month and compounding small wins into significant revenue gains over time.
Frequently asked questions
It depends on your industry. Food and beverage averages around 6%, fashion around 3%, and electronics about 1.4% according to Dynamic Yield benchmarks. The global all-industry average is approximately 1.56% (IRP Commerce, February 2026). Compare against your specific vertical, not the overall average.
Divide the number of completed purchases by the total number of unique visitors, then multiply by 100. For example: 50 purchases from 2,000 visitors = 2.5% conversion rate. Use unique visitors, not sessions, for the most accurate measurement.
Basic CRO tools (A/B testing, heatmaps) start at EUR 50-200 per month. Professional CRO audits range from EUR 2,000-10,000. AI-powered solutions like intelligent product advisory start at a few hundred euros per month and typically deliver 7-16x ROI within the first three months.
Quick fixes like adding trust badges or simplifying checkout forms can show impact within days. Structural changes like product page redesigns or AI implementation typically need 4-8 weeks for statistically significant data. Most stores see their first measurable improvement within 30 days.
At minimum: GA4 for funnel tracking, a heatmap tool like Hotjar for qualitative insights, and an A/B testing platform. For advanced CRO: AI product advisory for guided selling, personalization engines, and session replay tools to understand user behavior.
They complement each other. Traditional CRO (A/B testing, UX improvements) fixes friction points in the existing experience. AI-powered optimization adds a new layer: personalized product advisory, intelligent recommendations, and automated support. McKinsey reports a 10-15% revenue lift from personalization alone. The best results come from combining both approaches.
See how an AI team member can turn more visitors into buyers. Qualimero clients see +35% higher cart values and +60% checkout rate improvements, with 7-16x ROI.
Try free for 14 days
Lasse is CEO and co-founder of Qualimero. After completing his MBA at WHU and scaling a company to seven-figure revenue, he founded Qualimero to build AI-powered digital employees for e-commerce. His focus: helping businesses measurably improve customer interaction through intelligent automation.