Where Shopware stores lose revenue
The average ecommerce store converts 2.5% of its traffic into buyers, according to IRP Commerce data from Q3 2025. Stores above 3.2% rank in the top 20%. Reaching 4.7% puts you in the top 10%. Most Shopware merchants fall somewhere between 1.5% and 3.2%, which means at least 96 out of every 100 visitors leave without a transaction.
The device split makes this worse. Desktop shoppers convert at 3.9%, mobile at 1.8%, per Statista Q1 2026 data. Mobile accounts for roughly 70% of all ecommerce traffic. If your Shopware store is not optimized for mobile conversion, you are losing revenue on the majority of your visits. The mobile optimization guide covers every technical fix.
Cart abandonment compounds the problem. Baymard Institute analyzed 50 studies and calculated an average abandonment rate of 70.22%. The top reasons: unexpected shipping costs (47% of respondents), forced account creation (25%), and slow delivery estimates (24%). These are fixable design problems, not platform limitations. Our cart abandonment deep dive covers every recovery tactic in detail.
For a Shopware store generating EUR 50,000 in monthly revenue, a single percentage point improvement in conversion rate can add EUR 15,000 to EUR 20,000 in additional annual revenue. And that is a conservative estimate, because conversion improvements also compound with traffic growth.
Regional differences add another layer. Germany leads global ecommerce conversion at 2.22%, followed by the US at 1.96% and the UK at 1.88%. If you run a Shopware store targeting German customers, your benchmark is higher than the global average. Falling below 2% in the German market means you are underperforming relative to your competitive set.
The conversion gap also varies by industry. Beauty brands convert at 2-3%, fashion at 1.5-2.5%, health at 1-2%, and electronics at 0.5-1.5%. Knowing your industry baseline is critical. A 2% conversion rate looks poor for a beauty store but competitive for a consumer electronics retailer. The benchmarks below reflect cross-industry averages as of Q1 2026.
The question is not whether to optimize. It is where to start. The nine sections below cover the highest-impact levers, ranked by effort-to-impact ratio. For a detailed breakdown of what qualifies as a good conversion rate for your online store, or how your numbers stack up against average ecommerce conversion rate benchmarks by industry and region, those guides cover the data in full.
Ecommerce personalization: from anonymous visitors to known buyers
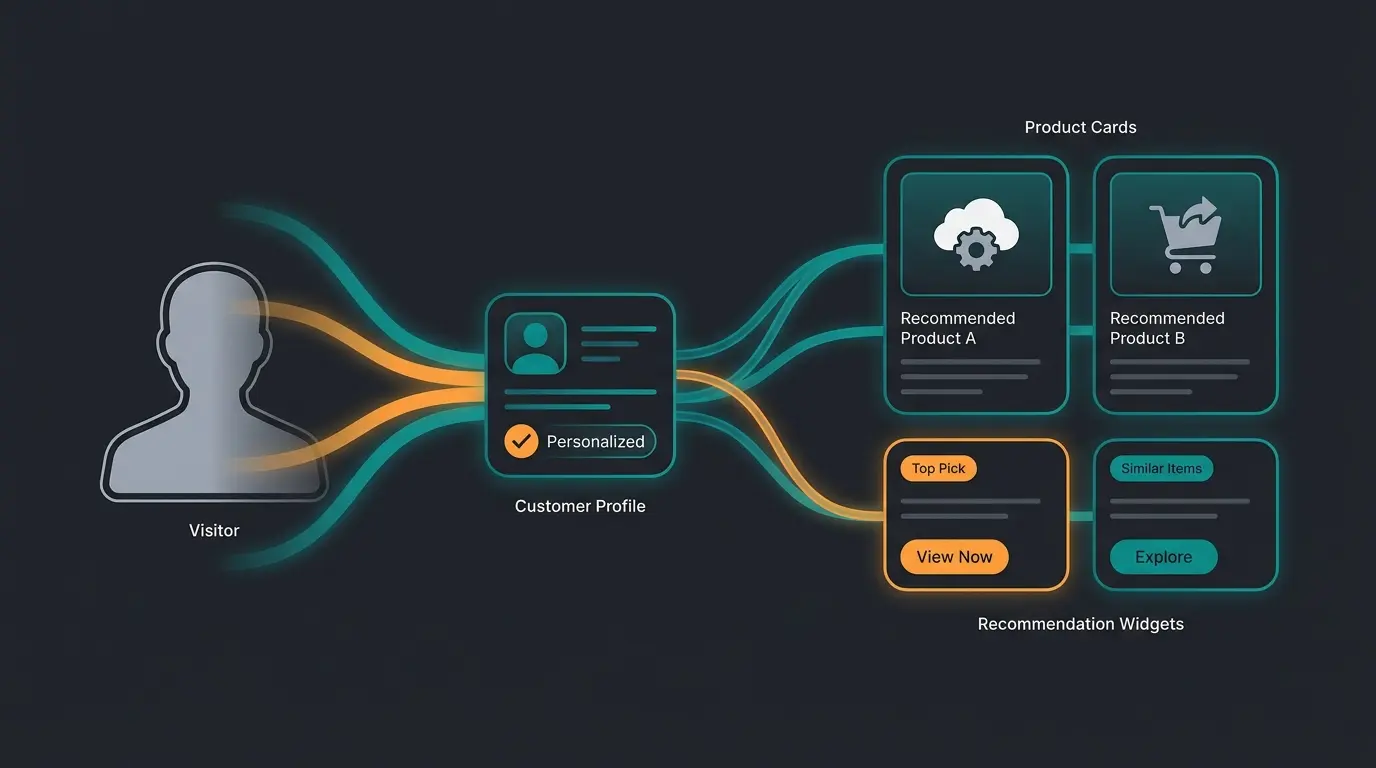
Ecommerce personalization increases conversion rates by 10-15% on average, with AI-driven approaches pushing that figure to 20-30%, according to a 2026 analysis by involve.me. The mechanism is straightforward: instead of showing every visitor the same catalog, you adapt product displays, pricing, and recommendations based on browsing behavior, purchase history, and customer segment. The result is a shopping experience that feels curated rather than generic.
The business case is consistent across studies. Accenture found that 91% of consumers prefer stores offering personalized experiences. Product recommendations alone drive up to 31% of ecommerce revenues, per Barilliance research. That is not a marginal uplift. For a store with EUR 100,000 monthly revenue, effective personalization can mean an additional EUR 25,000 per month.
The jump from basic to advanced personalization maturity delivers a median 18% conversion rate improvement. Basic personalization means showing bestsellers on the homepage. Advanced means adapting the entire product catalog, pricing structure, and content display to each visitor segment in real time.
Adoption is accelerating. 92% of ecommerce companies now use AI-driven personalization or have concrete plans to implement it by end of 2026. The top performers generate 40% more revenue from personalization than their peers. The gap between personalized and non-personalized stores is widening, not narrowing.
Shopware 6 provides three native tools for this. The Rule Builder lets you create dynamic rules based on customer segments, cart value, or purchase history: first-time buyers see a welcome discount, returning customers see loyalty pricing, high-value carts trigger free shipping thresholds. Dynamic Access controls which products or categories specific customer groups can see, useful for B2B stores with tiered pricing or region-restricted catalogs. Customer Specific Pricing adjusts pricing per segment without requiring separate storefronts. None of these require third-party plugins.
Alexander Schneiderbanger, Senior E-Commerce Consultant at best it, puts it directly: "A common mistake is treating all customers the same. With Shopware's Rule Builder, content, pricing, and promotions can be dynamically adjusted for different customer segments, yet many merchants still take a one-size-fits-all approach. Tailoring experiences based on data leads to significantly higher engagement and conversions."
We tested this extensively with Rasendoktor, an online lawn care retailer handling 2,000 to 3,000 consultation-intensive inquiries per season. Their team could not scale manual consultation. After implementing an AI-powered product advisor trained on their specific product expertise, the store achieved a 16x return on investment, with 100% of webchat inquiries answered automatically and 40% support cost savings. The AI did not just personalize recommendations. It replaced the entire manual consultation workflow.
The lesson from that deployment: personalization is not a feature you enable. It is a system you build. Segment your customers first (by behavior, not just demographics), test which product displays convert each segment, and then automate what works. For a comprehensive framework on how personalization fits into a broader ecommerce CRO strategy, that guide covers the full optimization loop.
Product page optimization for higher conversions
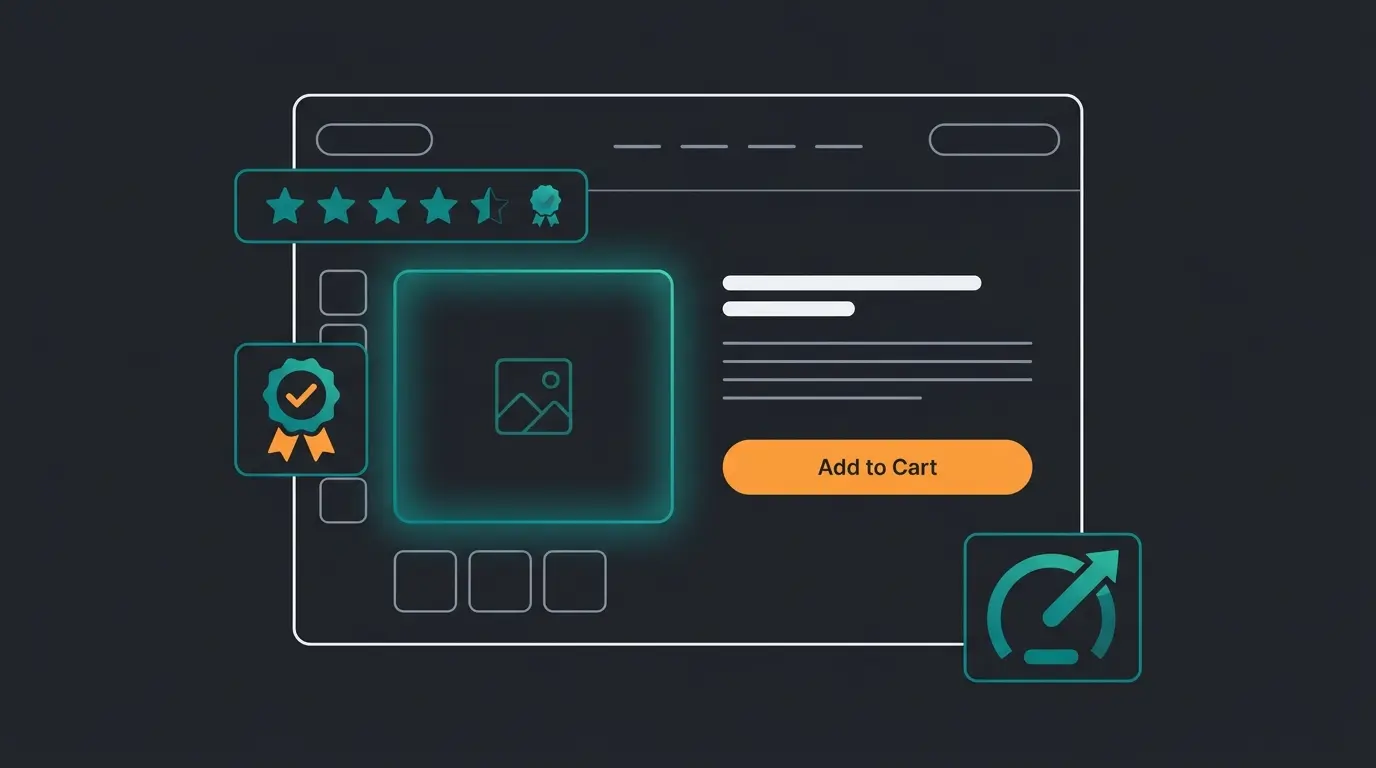
Product pages account for 38% of all A/B tests in ecommerce, and optimized PDPs deliver 12-28% higher conversion rates when changes reach statistical significance, per Optimizely analysis of 127,000 experiments. The product page is where buying intent converts into action, or doesn't. Every element on the page either builds confidence or introduces doubt.
Reviews are the single highest-impact trust signal. 98% of consumers read online reviews before purchasing, and displaying reviews can increase conversion rates by up to 270%, according to Spiegel Research Center findings. One counterintuitive detail: products with ratings between 4.2 and 4.7 stars convert better than those with a perfect 5.0. Mixed ratings appear more authentic. The optimal threshold for meaningful impact is 10 reviews per product, with peak performance at 50 to 100 reviews.
Product descriptions matter more than most merchants assume. The difference between a spec-sheet listing and a description that addresses the buyer's actual use case can be a 15-25% improvement in time on page and a measurable lift in add-to-cart rate. For consultation-intensive products, this means going beyond dimensions and materials. You need to answer: who is this for, when should you use it, and what problem does it solve?
| Element | Conversion impact | Implementation effort |
|---|---|---|
| Customer reviews (10+ per product) | Up to +270% | Low: integrate a review platform |
| High-quality product images (5+ per product) | +20-40% engagement | Medium: professional photography or 3D renders |
| Structured product attributes and use-case descriptions | +15-25% time on page | Medium: data enrichment and copywriting |
| Mobile page speed under 3 seconds | 53% of visitors leave if slower | High: image compression, lazy loading, plugin audit |
| Trust badges near add-to-cart button | +15-42% conversion | Low: placement and badge selection |
| Video content showing product in use | +80% time on page | High: production and hosting required |
| Social proof ("X customers bought this") | +10-15% add-to-cart rate | Low: Shopware plugin or custom snippet |
Mobile performance deserves special attention in 2026. 53% of mobile shoppers abandon sites that take longer than 3 seconds to load, per Google research. Shopware 6 stores running uncompressed images and more than 12 active plugins frequently exceed this threshold on mobile. The fix is technical but measurable: WebP image compression, lazy loading for below-the-fold content, asynchronous loading of tracking scripts, and removing plugins that inject JavaScript globally. A store generating EUR 50,000 monthly that reduces mobile load time from 4.5 to 2.5 seconds can expect a 7-14% conversion improvement on mobile traffic alone.
Signed, an online retailer for custom decorative signs, took a combined approach. They optimized product pages while deploying an AI-powered product advisor that handled 70% of customer inquiries across Instagram and TikTok. The result: 18x ROI and a 30% increase in upselling. The product page did not work in isolation. It worked as part of a system where intelligent consultation turned browsers into buyers.
If your product pages are underperforming but you are unsure which element to fix first, run a heatmap analysis (Hotjar or Microsoft Clarity, both integrate with Shopware). Look at where visitors scroll, where they click, and where they leave. The data tells you more than any general best practice. For the specific tactics that move conversion numbers on product pages, the guide on how to increase your conversion rate covers the full range of techniques.
Upselling and cross-selling strategies in Shopware
Upselling and cross-selling generate 10-30% of total ecommerce revenue, with existing customers converting at 60-70% probability compared to just 5-20% for new prospects. Amazon attributes 35% of its total revenue to upsell and cross-sell recommendations. The math is simple: increasing the value of each transaction is cheaper and more predictable than acquiring new customers.
The difference between the two is worth clarifying. Upselling moves the customer to a higher-priced variant of the same product: a 5-liter canister instead of 1 liter, a premium model instead of the base version. Cross-selling adds complementary products: a spray nozzle with the plant protection agent, a mounting kit with the sign. Both increase average order value (AOV), but through different mechanisms.
Shopware 6 supports both strategies natively. Cross-selling rules let you define product relationships at the category or individual product level, showing complementary items on PDPs and in the cart. The Rule Builder extends this with conditional logic: if cart value exceeds EUR 50, show a premium upgrade. If the customer belongs to a loyalty segment, surface accessories from a higher-margin category. If the customer viewed a product three times without purchasing, show a bundle discount.
McKinsey research shows that businesses implementing systematic cross-selling boost revenue by 20% and profits by 30%. Order bumps, the simplest form of upselling (a single-click add at checkout), achieve a 37.8% conversion rate when placed at the right moment. AI-powered recommendation engines push cross-sell revenue up by 15-25% over rule-based systems because they adapt to individual browsing patterns rather than static product relationships.
The customer lifetime value dimension is often overlooked. Upselling can increase a customer's lifetime value by 20-40%, making it a more efficient growth lever than acquisition. A customer who buys a premium variant and returns for accessories has a fundamentally different revenue trajectory than one who buys the cheapest option once. Cross-selling builds habitual purchasing patterns. One Shopware store we evaluated saw repeat purchase rates increase by 22% after introducing systematic accessory recommendations on order confirmation pages.
One approach that consistently works: bundle pricing. Instead of showing a cross-sell item as a separate purchase, offer it as a discounted bundle with the main product. Bundles convert 15-30% better than standalone cross-sells because the customer perceives a deal rather than an additional cost. Shopware's promotion engine supports automatic bundle discounts tied to product group rules.
For the technical implementation of product relationships, accessory bundles, and dynamic recommendation logic in Shopware 6, the Shopware cross-selling guide walks through each configuration step.
Checkout optimization and trust elements
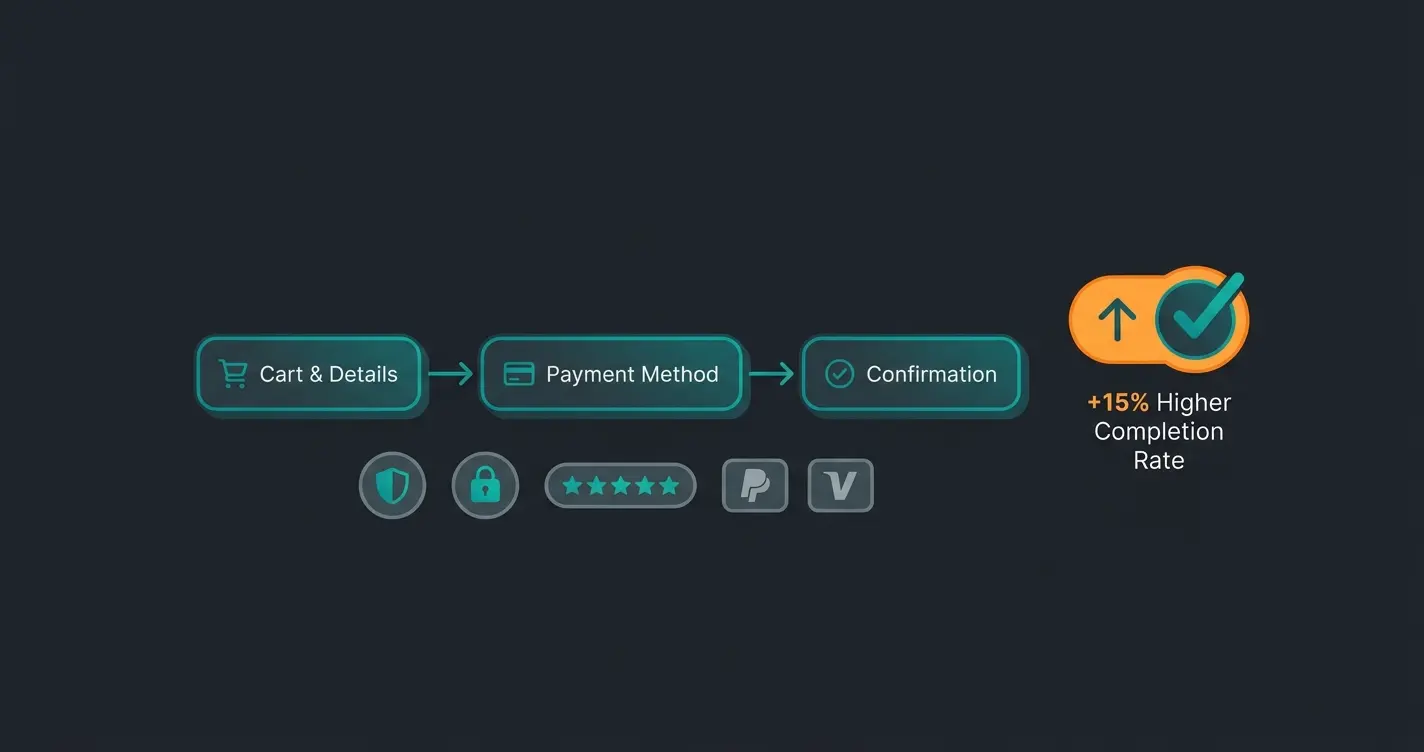
Checkout usability improvements alone can lift conversion rates by up to 35.26%, recovering a share of the $260 billion lost annually to poor checkout UX in the US and EU, according to Baymard Institute research. The checkout is where revenue either materializes or evaporates. Every unnecessary form field, every surprise fee, every extra page step costs completed orders.
Christian Otto Grotsch, Founder and Chairman at dotSource, frames the core principle: "The checkout should be completed with as few clicks as possible. Trust elements such as seals of approval, customer reviews, or 'Known from' logos create additional trust. Offering the right payment methods, such as PayPal, can also have a positive impact on the conversion rate."
Baymard's data identifies specific failure points. Forced account creation causes 25% of abandonments. Hidden costs appearing at checkout cause 47%. Limited payment options cause 13%. These three problems alone account for the majority of preventable checkout abandonment. Solving them does not require a redesign. It requires configuration changes that can be done in a day.
One-page checkouts deliver approximately 7.5% higher conversion rates than multi-step alternatives, per Groove Commerce analysis. Shopware 6 ships with an optimized one-page checkout by default. If your store still uses a multi-step checkout from a custom theme, switching to the default template is one of the highest-ROI changes you can make. For a detailed breakdown of every checkout element that impacts revenue, see our Checkout Optimization guide.
Trust elements that move the needle
Trust badges increase conversion rates by 15-42% depending on placement and industry, per Shopify research. The placement hierarchy matters: checkout badges outperform product page badges, which outperform homepage badges. Security seals placed near the payment button have the highest impact because they address buyer anxiety at the exact moment of financial commitment.
Displaying security badges specifically near the checkout button reduces cart abandonment by up to 32%. Clear return policies reduce it by an additional 28%. These are not competing tactics. They stack. A store that adds both a security badge and a visible return policy near the purchase button captures roughly 40-50% of the trust-related abandonment that was previously lost.
Which trust signals work depends on your market. For German and DACH customers, Trusted Shops, TUV seals, and Ekomi ratings carry weight. For international stores, Norton Secured, McAfee, and payment provider logos (PayPal, Klarna) are more recognized. The common mistake is using generic lock icons instead of recognized third-party seals. Generic icons lack the verification signal that makes trust badges effective.
- Enable guest checkout (removes the cause of 25% of abandonments)
- Display trust badges (SSL seal, Trusted Shops, payment provider logos) near the purchase button
- Show shipping costs on the product page, not first at checkout
- Offer at least 3 payment methods including PayPal, credit card, and Klarna or SOFORT
- Use one-page checkout layout (Shopware 6 default)
- Display return policy prominently in the cart sidebar
- Add customer review count or average rating near the checkout CTA
- Remove upsell distractions from the final payment confirmation step
- Show estimated delivery date before checkout, not after
- Add a progress indicator if using multi-step checkout (shows customers where they are)
One pattern we see consistently: stores that display shipping costs only at checkout lose 15-20% more customers than those showing delivery fees on the product page. Transparency early in the funnel beats surprise late in the funnel. Every time. The same applies to return policies: a prominently displayed "30-day free returns" badge reduces the perceived risk of purchase and directly increases add-to-cart rates.
A/B testing for ecommerce conversion optimization
Structured A/B testing programs deliver an average 223% ROI when executed systematically, with cumulative annual conversion improvements of 25-40% from stacked individual wins, according to VWO data. The catch: most ecommerce stores either do not test at all, or test without statistical rigor. Both waste money.
Optimizely's analysis of 127,000 experiments reveals a sobering baseline. Only 12% of tested ideas produce a statistically significant positive result. That is the average. Mature testing programs with strong hypothesis generation achieve 22-30% win rates. The difference is not the tool. It is the process: clear hypotheses, adequate sample sizes, and patience to reach significance before calling a winner.
Christoph Krebs, Head of CRO at Digitas, frames the right mindset: "Experiment, test, learn, rinse, and repeat. Don't hesitate to test significant changes and optimizations with a small percentage of your buyers. Even a quick, informal user test can provide valuable insights to kick-start your optimization process."
| Test area | Average conversion lift | Notes |
|---|---|---|
| Product detail page layout | +12-28% | 38% of all ecommerce tests target PDPs |
| CTA button (color, text, placement) | +28% average | Most frequently tested element across all industries |
| Checkout flow simplification | +7.5% for one-page vs multi-step | High impact but undertested by most stores |
| Product image variations | +20-40% engagement increase | Low cost, high return on effort |
| Pricing display format | +5-15% depending on context | Sensitive: requires careful segmentation |
| Category page sorting algorithm | +8-18% for relevance-based sorting | Often overlooked in favor of PDP tests |
| Search results ranking | +15-25% for search users | Site search users convert at 2-3x baseline |
Segmentation-driven tests deliver approximately 2.8x the ROI of blanket population tests. If you test a new PDP layout on all visitors, you measure the average effect. If you segment by device type, traffic source, or customer value tier, you find where the effect is strongest. A layout change that shows a 3% improvement overall might show a 15% improvement on mobile and a 1% decline on desktop. Without segmentation, you would never know.
Shopware 6 does not include native A/B testing. You need a third-party tool: VWO, Optimizely, or AB Tasty all integrate through Shopware's theme system and tag manager support. The setup takes a day. The real investment is building a testing culture where decisions are backed by evidence instead of opinion. Start with two tests per month on your highest-traffic pages, measure results over full two-week cycles, and scale from there.
CTA testing alone improves overall button performance by an average of 28%, driven by changes in color, copy, placement, and timing. One common finding: green and orange buttons outperform blue and grey buttons in ecommerce, but the specific winner varies by store. That is precisely why testing matters. Your audience is not average.
I would argue that A/B testing is the most undervalued conversion lever in ecommerce. Not because the lifts are the largest, but because testing compounds. A series of 5-10% improvements over 12 months creates a fundamentally different store than one-off redesigns. Ecommerce brands running structured programs achieve cumulative annual improvements of 25-40% by stacking a series of small wins.
AI-powered product consultation: the conversion multiplier
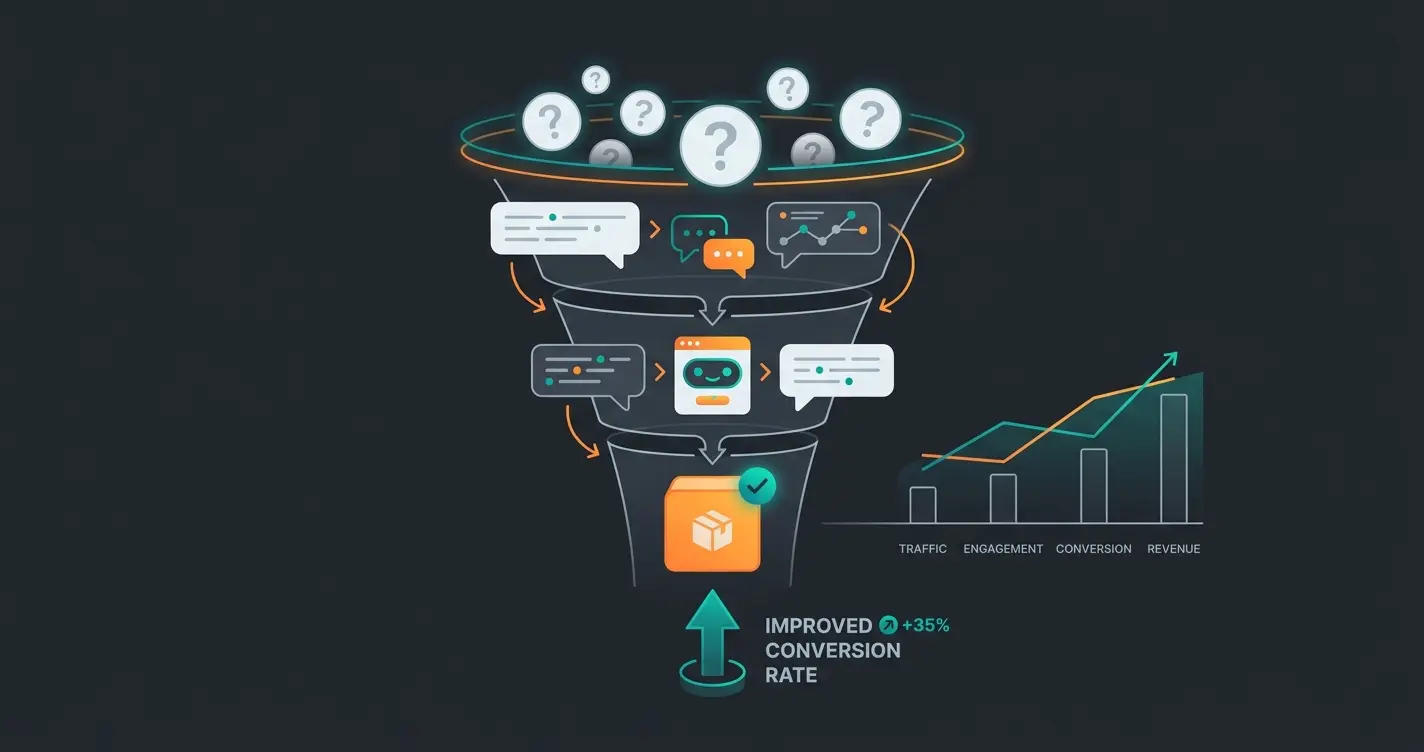
AI product consultation transforms passive browsing into guided buying. Stores using AI-driven product advisors see conversion rates multiply by factors of 4x to 7x compared to unassisted sessions, based on deployment data from stores with consultation-intensive product catalogs. The mechanism is not complicated: when a customer gets a relevant product recommendation with reasoning behind it, the friction between interest and purchase drops.
This is not a theoretical claim. Gartenfreunde, an online garden and wellness retailer, handled up to 50 consultation-intensive inquiries per day during peak season with a single sales employee. After deploying an AI product advisor trained on their product catalog and domain expertise, the store achieved a 7x higher conversion rate, a 45% click-through rate on AI recommendations, and a 6x ROI. The AI scaled what the human employee could not.
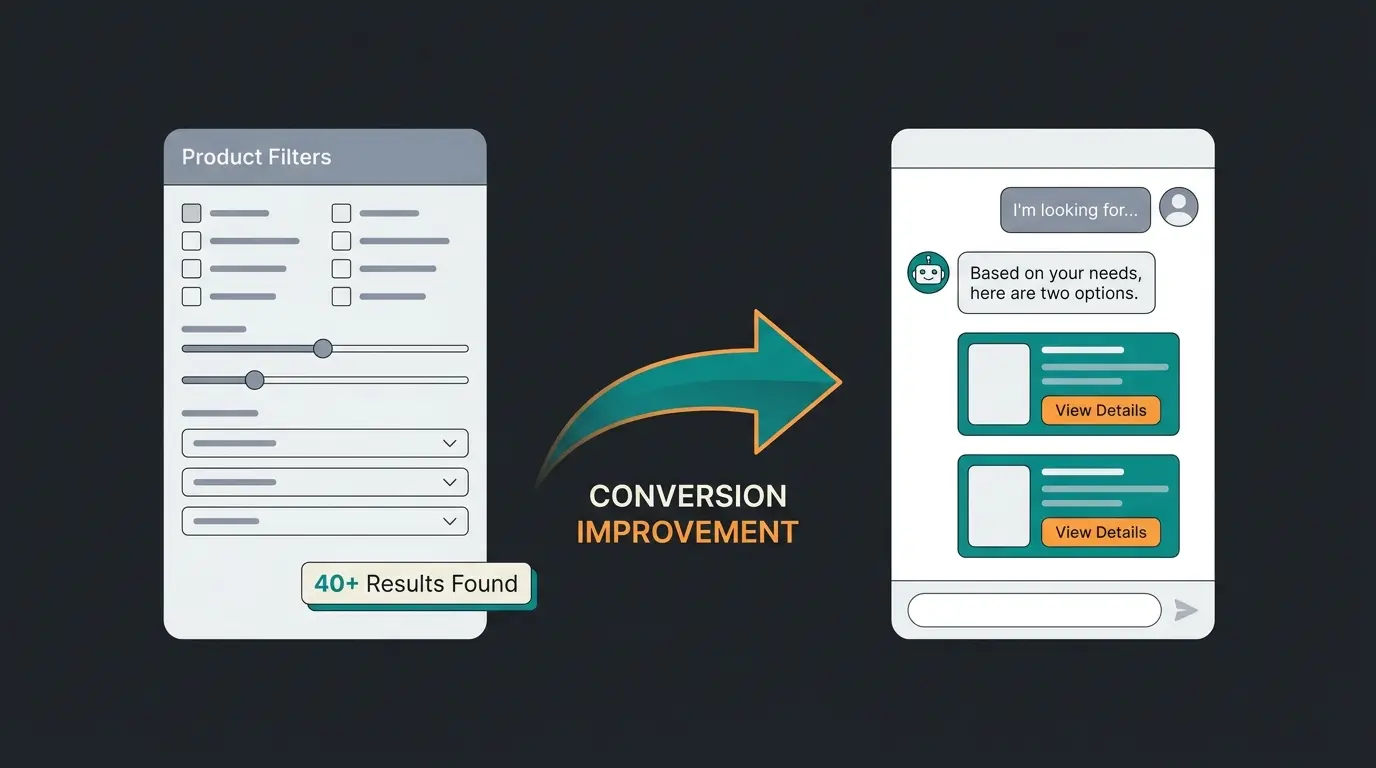
The distinction between an AI product advisor and a traditional search or filter system is fundamental. A filter lets the customer narrow down options based on attributes they already understand. An AI advisor asks about the customer's situation and recommends based on fit. A customer searching for "lawn fertilizer" might see 40 results with a filter. An AI advisor asks about soil type, lawn condition, season, and desired outcome, then recommends the two products that actually fit.
How AI product recommendations work in practice
Traditional recommendation engines rely on collaborative filtering: "customers who bought X also bought Y." That works for stores with large purchase datasets. Amazon can do this because they have hundreds of millions of transactions to learn from. For the majority of Shopware merchants with fewer than 50,000 monthly visitors, the data is too sparse for collaborative filtering to produce meaningful results.
AI product consultation solves this differently. Instead of relying on aggregate purchase patterns, it analyzes the individual customer's stated needs, matches them against product attributes and domain knowledge, and recommends based on fit. The AI understands that a customer asking about lawn disease treatment in clay soil needs a different product than someone with sandy soil, even if both typed "lawn treatment" into the search bar.
Neudorff, a leading German garden care manufacturer, implemented this approach with their AI product advisor Flora. The results were measurable: 97% accuracy in product recommendations, average response times under 5 seconds, and cost savings of 99% per consultation interaction compared to human agents. That accuracy level is not achievable with rule-based recommendation engines that rely on static product mappings.
The 97% accuracy matters for a specific reason: wrong recommendations in consultation-intensive categories lead to returns. Every return costs the store money, creates customer friction, and reduces lifetime value. An AI advisor that recommends the right product the first time directly reduces return rates while increasing first-purchase satisfaction.
The product finder approach: guided selling for complex catalogs
Product finders are the interactive version of a buying guide. Instead of asking the customer to evaluate specifications and compare products manually, a product finder walks through a series of questions and narrows the catalog to the best matches. Site search users already convert at 2-3x the rate of non-searchers. A product finder that understands intent and context converts even higher.
The format works best for catalogs where the right choice depends on the customer's specific situation. Plant protection products (application depends on soil type, pest species, season). Heating systems (depends on house size, insulation quality, fuel preference). Vehicle lighting (depends on model, mounting type, road legality requirements). In each case, the customer cannot make the right choice without domain knowledge. The product finder provides that knowledge interactively.
HELLA Lightstyle, an automotive lighting manufacturer, deployed an AI advisor for technically complex inquiries about auxiliary lighting, including legal approval questions and ECE regulation guidance. The result: 60% fewer support inquiries, 24/7 technically competent consultation, and 100% legally compliant product recommendations. Customers arrived at workshops with clear purchase decisions instead of vague requests.
See how AI product consultation works for stores with complex product catalogs and consultation-intensive purchase decisions.
Building a conversion optimization roadmap
Not every tactic deserves equal investment. The right sequence depends on your current conversion rate, traffic volume, and product type. Here is the prioritization we recommend after evaluating deployments across dozens of Shopware stores.
Enable guest checkout, display shipping costs on PDPs, add trust badges near payment. Lowest effort, highest immediate impact. Most stores see results within the first week.
Add reviews (minimum 10 per top product), compress images for mobile speed under 3 seconds, add trust badges near add-to-cart. Addresses the 38% of conversions happening on PDPs.
Use Shopware Rule Builder for segment-based pricing, Dynamic Access for targeted product displays. Start with two segments: new vs returning customers.
Install VWO or AB Tasty, run two tests per month on highest-traffic pages. Build the data foundation before scaling. Most wins come from PDP and CTA tests.
Configure product relationships and bundle discounts. Place upsells on PDPs and cart, not at payment. Target: 10-30% AOV increase.
For consultation-intensive catalogs, AI advisors multiply conversion 4-7x. The ROI typically justifies setup within the first quarter of operation.
The stores that see the largest conversion gains are not the ones running the most tactics simultaneously. They are the ones that measure before and after each change, discard what does not work, and double down on what does. Conversion optimization is a system. Treat it like one.
One thing I have learned from evaluating these implementations: the first 20% of effort delivers 80% of the conversion improvement. Guest checkout, mobile speed, and trust badges account for more conversion lift than any amount of personalization or AI. Fix the basics first. Then scale with technology.
The global average ecommerce conversion rate is 2.5% as of Q3 2025, per IRP Commerce. Stores above 3.2% rank in the top 20%, and 4.7%+ places you in the top 10%. Shopware stores with consultation-intensive products typically start lower (1.5-2.5%) but have more room for improvement through guided selling and personalization.
Baymard Institute estimates that fixing documented checkout usability issues can increase conversion rates by up to 35.26%. The highest-impact changes are enabling guest checkout (removes 25% of abandonment causes), displaying shipping costs before the checkout page, and using Shopware's default one-page checkout layout.
Personalization increases conversion rates by 10-15% on average, with AI-driven implementations reaching 20-30%. Product recommendations alone account for up to 31% of ecommerce revenues, per Barilliance. The key is deploying personalization on high-intent pages first (product pages, category pages) rather than starting with the homepage.
Structured A/B testing programs deliver an average 223% ROI according to VWO. The caveat: only 12% of tested ideas produce statistically significant positive results. Mature programs with strong hypothesis generation reach 22-30% win rates and cumulative annual improvements of 25-40%.
A rule-based system follows pre-programmed decision trees and breaks when catalogs change. An AI product advisor understands product attributes, customer context, and domain-specific requirements. In tested deployments, AI advisors achieve conversion multipliers of 4-7x with accuracy rates above 97% for recommendations, compared to sub-40% accuracy for rule-based filtering approaches.
An AI product advisor turns visitors into buyers. Qualimero customers see conversion rates multiply by up to 7x and cart values increase by 35%. Book a demo to see what that means for your Shopware store.
Book a demo
Kevin is CTO and co-founder of Qualimero. As an AI architect with over 15 years of experience as CTO and CPO in the tech industry, he designs the AI systems that automate tens of thousands of customer interactions daily for Qualimero's clients — reliably, securely, and at scale.