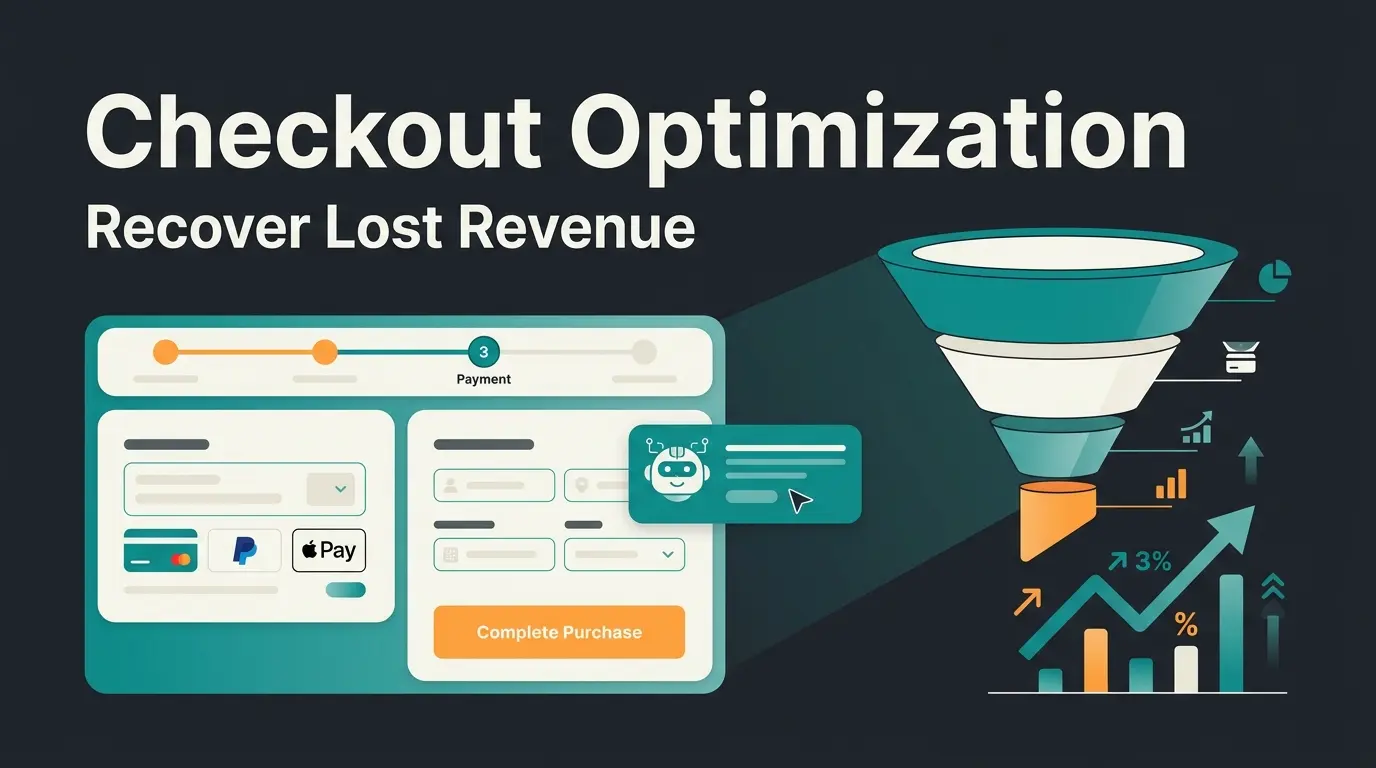
Open the analytics tab of a Shopify store doing 40,000 sessions a month and 520 orders, and the owner will almost always tell you the same thing. They need more traffic. They do not.
At 1.3% that store is leaving roughly 240 orders a month on the table against a store converting at 1.9%, and those orders cost nothing in ad spend. Conversion work is unglamorous. It is also the only growth lever that gets cheaper the longer you run it.
What is Shopify conversion rate optimization?
Shopify conversion rate optimization is the practice of systematically increasing the share of store sessions that end in an order, by removing friction across the product page, cart, checkout and mobile experience. It is measured as orders divided by sessions, and it is the cheapest growth lever available because it raises revenue without raising ad spend.
The formula matters more than it looks. Shopify Analytics divides orders by sessions, not by people. A shopper who browses on the train, again at lunch, and buys that evening counts as three sessions and one order, which is exactly why your Shopify number reads lower than a user-based figure in GA4.
Shopify's own CRO documentation, updated in March 2026, calls the store conversion rate the metric that "measures the percentage of total online store sessions that resulted in an order". That session-based number is the standard, and it is the one every benchmark in this article uses.
The economics are what make this worth your Monday morning. Take a store at 1.4% on 30,000 sessions a month: 420 orders. Move it to 2.8% and you have 840 orders on identical traffic, the same ad budget, the same team. Doubling traffic instead would cost you the entire acquisition bill twice over.
One of those two projects is free after the fix ships. The other bills you every month.
Shopify CRO is also not just generic ecommerce conversion rate optimization with a different logo in the admin. On Shopify you do not own the checkout code the way you would on a self-hosted store, so a large share of the usual advice about rebuilding the payment flow is simply unavailable to you. What you do control is everything before checkout, plus a specific handful of settings inside it.
What is a good Shopify conversion rate in 2026?
A typical Shopify store converts between 1.4% and 1.8% of sessions. Above roughly 3.2% is strong, and below 1% signals a specific structural problem rather than general underperformance. Treat every benchmark as a range that shifts by vertical, price point and traffic source, not as a target.
Those figures come from Littledata's Shopify benchmark set for 2026, which puts the average at 1.4%. Above 3.2% places you in the best 20% of the stores they measure. Above 4.7% places you in the best 10%.
Vertical moves the number more than any tactic will. Fashion averages 1.9%. Food and beverage sits at 1.5%. Travel, where the purchase is considered and expensive, averages 0.2%, and a travel store benchmarking itself against a fashion store will conclude it is failing when it is doing fine.
Device splits it again: 1.2% on mobile against 1.9% on desktop. Most Shopify traffic is mobile, which means the blended number in your dashboard is dragged down by the device where most of your visitors actually are. Traffic source changes it a third time. The full breakdown by industry and channel lives in our average ecommerce conversion rate benchmarks, and it is worth reading properly before you set any target.
Use benchmarks to size the gap. Do not use them as a goal. A 1.1% store with a broken mobile checkout and a 1.1% store selling EUR 4,000 machinery have nothing in common except a number.
Find what is actually killing your conversion rate
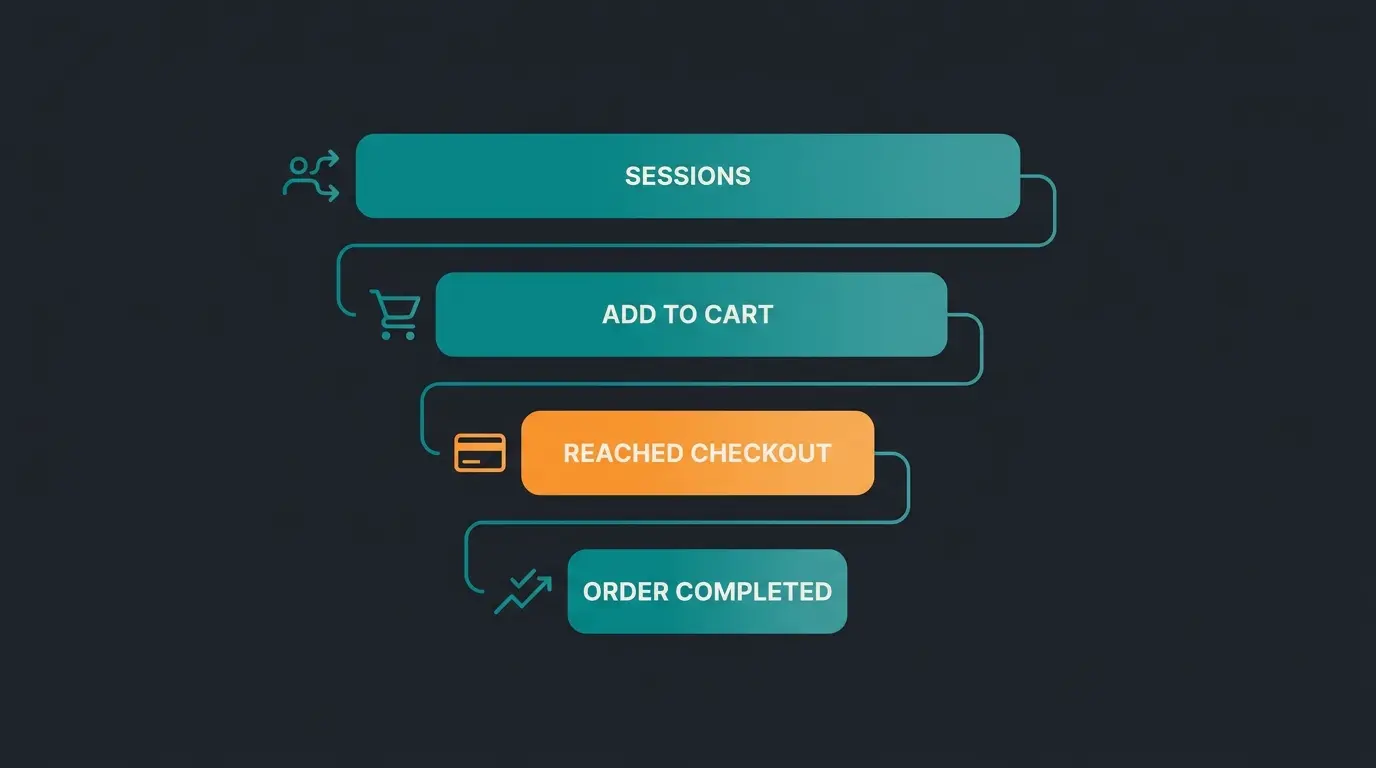
Before changing anything, isolate which funnel stage leaks. Compare Shopify Analytics sessions, add-to-cart rate, reached-checkout rate and completed-orders rate. The stage with the largest drop against benchmark is your bottleneck, and fixing anything else first is wasted effort.
Shopify gives you those four numbers in Analytics under the conversion breakdown: sessions, sessions that added to cart, sessions that reached checkout, and sessions that converted. Read them as a chain, not as four separate metrics.
Rough shape for a healthy store: somewhere between 6% and 12% of sessions add to cart, most of those go on to reach checkout, and roughly a third of the sessions that start checkout complete it. The Baymard Institute's documented abandonment average, calculated across 50 separate studies, is 70.22%, so a two-thirds drop at that final step is normal rather than alarming.
The agencies doing this at volume land in the same place. Convertcart's CRO team, writing in March 2026 after auditing hundreds of Shopify stores, put it plainly: "low conversion rates usually aren't caused by a single issue. Instead, they stem from a handful of recurring patterns, ones that founders and marketers often miss, because they see the store every day." (Convertcart)
The routing below is the version I use on client calls. Find your symptom, then go straight to that section.
| What you are seeing | Likely cause | Where to fix it |
|---|---|---|
| Traffic is healthy, add-to-cart is under 5% | The product page is not answering the buying question | Fix the product page |
| Add-to-cart is fine, reached-checkout is low | Cart friction or shipping cost shock in the cart drawer | Fix the checkout and cart |
| Checkout is reached but rarely completed | Extra costs, forced account creation, or missing payment methods | Fix the checkout and cart |
| Mobile converts far below desktop | Load time, app script bloat, or unreachable tap targets | Fix speed and the mobile experience |
| Visitors return repeatedly and still do not buy | An unanswered product question, not a pricing problem | AI product advisory |
| Conversion is fine but revenue per session is flat | Order value, not conversion rate, is the constraint | Raise order value without raising traffic |
One caveat I have learned the hard way. If two stages are both weak, fix the later one first. Sending more people into a checkout that loses 80% of them just moves the loss downstream, and it makes the product page work look like it failed when it did not.
Fix the product page
Product pages lose buyers when they fail to answer a purchase question the visitor cannot resolve alone. Fix them in priority order: decision-critical information above the fold, then proof such as reviews and customer photos, then media quality. Visual polish without answered questions does not move conversion.
Baymard's benchmark of the world's leading ecommerce sites found that up to 62% have product page UX rated mediocre or worse, and that 10% of sites run product descriptions insufficient for what users need to decide. Those are the sites with budget and dedicated UX teams. The gap on a mid-market Shopify store is usually wider.
Work in this order.
- Decision-critical information above the fold. Not brand copy. The two or three facts that actually decide the purchase: fit, compatibility, dosage, dimensions, delivery date.
- Proof next to the decision. Reviews and customer photos beside the add-to-cart button, not parked at the bottom of the page where nobody scrolls.
- Shipping cost and return terms on the product page. If the shopper learns the real total at checkout, you have engineered your own abandonment.
- Media that answers a question. A twelve second video showing the product in use beats six more studio angles of the same box.
Here is where the standard advice runs out. Better photography works when the shopper already knows what they want and needs reassurance. It does nothing at all when the shopper does not know which of your forty products fits their situation.
A lawn care store is the clean example. The visitor does not need a sharper photo of a fertiliser bag. They need to know which one suits a shaded clay lawn in April, in their region, at their lawn size. No photograph answers that. No FAQ page answers it either, because the answer depends on four variables the shopper has to supply first.
That is a different failure mode, and it needs a different fix.
Fix the checkout and cart
Checkout is where the highest-intent traffic is lost, so it returns the most per fix. Enable guest checkout, offer accelerated payments such as Shop Pay and Apple Pay, surface the total cost including shipping before the final step, and cut every field that is not required to fulfil the order.
The documented average is 70.22% of carts abandoned, calculated by the Baymard Institute across 50 separate studies. The reasons are not mysterious. Extra costs, meaning shipping, taxes and fees appearing late, drive 39% of abandonments. Delivery being too slow drives another 21%.
Accelerated wallets are the highest-return switch you can flip, and the numbers are Shopify's own. A study Shopify commissioned with a Big Three consulting firm found Shop Pay lifts conversion by up to 50% against guest checkout and checks out four times faster. Across all checkouts the average lift is 9%, rising to 18% for returning customers. Merely displaying the button, even when the shopper does not use it, moved lower funnel conversion by 5%.
| Where in Shopify | Change | Why it pays |
|---|---|---|
| Settings > Checkout > Customer accounts | Set accounts to optional, never required | Forced account creation is a top documented abandonment cause |
| Settings > Payments | Enable Shop Pay, Apple Pay and Google Pay | Up to 50% conversion lift against guest checkout |
| Settings > Shipping and delivery | Show real rates and a delivery estimate before the final step | Late cost surprises drive 39% of abandonments |
| Settings > Checkout > Form options | Switch off every field not needed to fulfil the order | Company name and second address lines add friction without adding value |
| Cart drawer in your theme | Show a free-shipping progress indicator and the full running total | Removes the cost shock before the shopper commits |
| Settings > Checkout > Marketing options | Do not pre-check the newsletter opt-in | It reads as a dark pattern and costs trust at the worst possible moment |
Checkout deserves more room than one section can give it. The full sequence, including one-page checkout, wallet ordering and post-purchase offers, is in our guide to checkout optimization.
If you only do one thing this quarter, do this section. Checkout traffic has already told you it wants to buy. Everything else in CRO is persuasion. This is just getting out of the way.

Fix speed and the mobile experience
Most Shopify traffic is mobile, and mobile converts materially worse than desktop, so speed and thumb-reach problems compound. Audit installed apps for script bloat, compress images, and verify that add-to-cart and checkout buttons are reachable and tappable on a small screen.
The gap is measurable. Littledata's Shopify set puts mobile at 1.2% average against 1.9% on desktop, roughly a 37% shortfall on the device carrying most of your traffic. Closing even a third of that gap is worth more than most product page work.
On Shopify the dominant speed problem is not your images. It is apps. Every app you install injects script into the storefront, and uninstalling an app does not reliably remove its code from the theme. Stores that have been live for four years routinely carry scripts from tools they stopped paying for in 2023.
- List every installed app and the last date you actually used it. Uninstall anything you cannot justify out loud.
- Check the theme code for orphaned scripts after each uninstall. Search the theme files for the app name and remove what is left behind.
- Run the store through Lighthouse on a throttled mobile connection, not on office wifi on a desktop with everything cached.
- Then thumb-test it. Hold the phone one-handed and try to reach add-to-cart and checkout without shifting your grip.
That last one takes ninety seconds and it still finds problems on stores that have passed a paid audit. It annoys me more than it probably should.
AI product advisory, the lever this market ignores
For consultation-intensive products, the largest remaining conversion gap is unanswered pre-purchase questions, and no amount of page polish closes it. An AI employee that understands the catalogue answers those questions in the moment of doubt, which is why Qualimero accounts see roughly +35% cart value and +60% checkout rate.
The problem class is specific. Complex, technical or regulated products. Wide catalogues. Purchases where the shopper needs advice they cannot get by reading harder. Plant protection. Pool chemistry. Heating systems. Machinery with compatibility constraints. In these catalogues the conversion ceiling is set by unanswered questions, and layout work does not raise it.
The distinction matters here. A rules-based system matches keywords to canned replies and fails the moment the question is phrased differently. A KI-Mitarbeiter, a digital team member, holds the actual product data, remembers what the customer said three messages earlier, and reasons about which product fits the situation described. One deflects support volume. The other closes sales.
Rasendoktor sells professional lawn care and was taking 2,000 to 3,000 consultation-heavy enquiries a season. Response times stretched and the support team could not keep pace. Hektor, the AI employee trained on their own expertise, now handles the webchat enquiries end to end: a 100% automation rate, 40% saved on support cost, and a 16x return on investment.
Pooldoktor is the more rigorous case, because it was measured against a control group. Franz went live in January 2026 and handles over 1,100 conversations a month, half of them genuine consultation about water chemistry, filtration and pump sizing. Average response time is 13 seconds. Each conversation generates EUR 112 in revenue, revenue per user runs 18.75% above the control group, and the return on investment is 33x.
The line from the Pooldoktor case documentation is the one worth keeping: "Causally measured, not claimed." Uplift claims in this category are usually neither, which is why the control group matters more than the headline number.
Now the honest part. This does nothing for a store selling phone cases. If your shopper already knows exactly what they want and the only open questions are price and delivery, advisory adds a step and helps nobody. The lever works where the decision is genuinely hard, and nowhere else.
Where it does apply, it sits alongside the rest of your stack rather than replacing it. We compared the options in our roundup of Shopify AI tools, and the mechanics of AI product consultation are worth understanding before you scope anything.

Raise order value without raising traffic
Conversion rate is only one half of revenue per session. Cross-sells, bundles and free-shipping thresholds raise average order value on the same traffic, and in low-traffic stores they are often the faster win because they need no statistical test to justify.
Revenue per session is the metric that reconciles the two. A store at 1.4% with a EUR 90 average order takes EUR 1.26 per session. A store at 1.4% with a EUR 120 average order takes EUR 1.68. The second store did nothing at all to its conversion rate.
This is also where the trade-off lives, and most guides skip it. A free-shipping threshold set well above your average order raises order value and lowers conversion, because some shoppers walk rather than add. Set it just above your median order rather than your average, and watch both numbers instead of one.
Relevance is the whole game with cross-sells. A recommendation the shopper would have wanted anyway reads as service. A random one reads as a checkout tax. The mechanics are covered separately in our guide to Shopify cross-selling.
For a store doing 200 orders a month, order value work is usually the faster win. It needs no statistical test to justify, and the effect shows up within a fortnight rather than next quarter.
How to test changes without fooling yourself
Most Shopify stores do not have the traffic for valid A/B testing. Below roughly 1,000 orders a month, prefer sequential before and after measurement over fixed periods, and ship obvious fixes without testing them at all. Testing a change you already know is correct wastes the traffic you would need for a real question.
The arithmetic is unforgiving. Detecting a 10% relative improvement on a 2% baseline at conventional confidence needs somewhere in the region of 30,000 sessions per variant. A store doing 20,000 sessions a month runs that test for three months, and by then the season has turned and the result is contaminated.
So my position, which plenty of CRO people will disagree with: most Shopify stores should not run A/B tests at all. Below roughly 1,000 orders a month the traffic simply is not there, and the test is theatre with a dashboard attached.
Do this instead. Ship the changes you already know are correct, guest checkout, accelerated wallets, honest shipping costs, without testing them. Nobody needs a split test to prove that hiding the shipping cost until step four is bad. Then measure sequentially: fixed periods of equal length, the same traffic mix, one change at a time.
Shopify CRO priorities at a glance
Rank every fix by effort against expected impact. Guest checkout, accelerated payments and shipping-cost transparency are low effort and high impact, so they ship first. Theme replacement and full redesigns are high effort with uncertain returns, so they ship last or never.
| Fix | Funnel stage | Effort | Expected impact |
|---|---|---|---|
| Enable Shop Pay and express wallets | Checkout | Low | High |
| Make customer accounts optional | Checkout | Low | High |
| Show shipping cost and delivery date early | Product page and cart | Low | High |
| Remove unused apps and orphaned scripts | Sitewide speed | Medium | Medium to high |
| Rework the product page information hierarchy | Product page | Medium | Medium to high |
| Add AI product advisory | Product page and cart | Medium | High for consultation-heavy catalogues, negligible otherwise |
| Replace the theme or run a full redesign | Sitewide | High | Uncertain |
Shipping, taxes and fees appearing late in checkout
Measured against a control group, live since January 2026
Work top to bottom. The stores that plateau are almost always the ones that started at the bottom.
Frequently asked questions
The average Shopify store converts 1.4% of sessions, and anything above 3.2% puts you in the best 20% of stores (Littledata). Your realistic target depends on vertical and price point: fashion averages 1.9%, food and beverage 1.5%, travel 0.2%. Compare yourself against your own category, not against a blended figure.
Sudden drops are almost always traffic mix or a technical break, not a gradual UX decline. Check whether a new paid campaign added colder traffic, whether a payment method started failing on mobile, and whether a recent app install slowed the storefront. Compare the funnel stage by stage to see where the drop actually starts.
Checkout and payment fixes show up in the data within two to four weeks because they affect high-intent traffic immediately. Product page and information changes take longer, usually a full quarter, because they influence shoppers earlier in the decision. Redesigns can take two quarters before the effect is readable at all.
Detecting a 10% relative lift on a 2% baseline needs roughly 30,000 sessions per variant at conventional confidence. Below about 1,000 orders a month, run sequential before and after comparisons over four-week periods instead. Ship obvious fixes such as guest checkout without testing them at all.
Some do, but every app adds storefront script, and app bloat is the dominant speed problem on established Shopify stores. Judge each one on whether it removes a friction point you have actually diagnosed. An app installed to fix a problem you have not measured usually costs more in load time than it returns.
Hire one when you have diagnosed the bottleneck and lack the capacity to fix it, not when you want someone to tell you what is wrong. Agencies earn their fee on product page research and checkout rebuilds. The low-effort wins in this article, wallets, optional accounts and honest shipping costs, you can ship yourself this week.
If your catalogue needs explaining before it sells, a KI-Mitarbeiter answers those questions in the moment of doubt. Rasendoktor reached a 100% automation rate and 16x ROI. Pooldoktor measured +18.75% revenue per user against a control group. See what the same setup looks like for your store.
Book a demo
Lasse is CEO and co-founder of Qualimero. After completing his MBA at WHU and scaling a company to seven-figure revenue, he founded Qualimero to build AI-powered digital employees for e-commerce. His focus: helping businesses measurably improve customer interaction through intelligent automation.