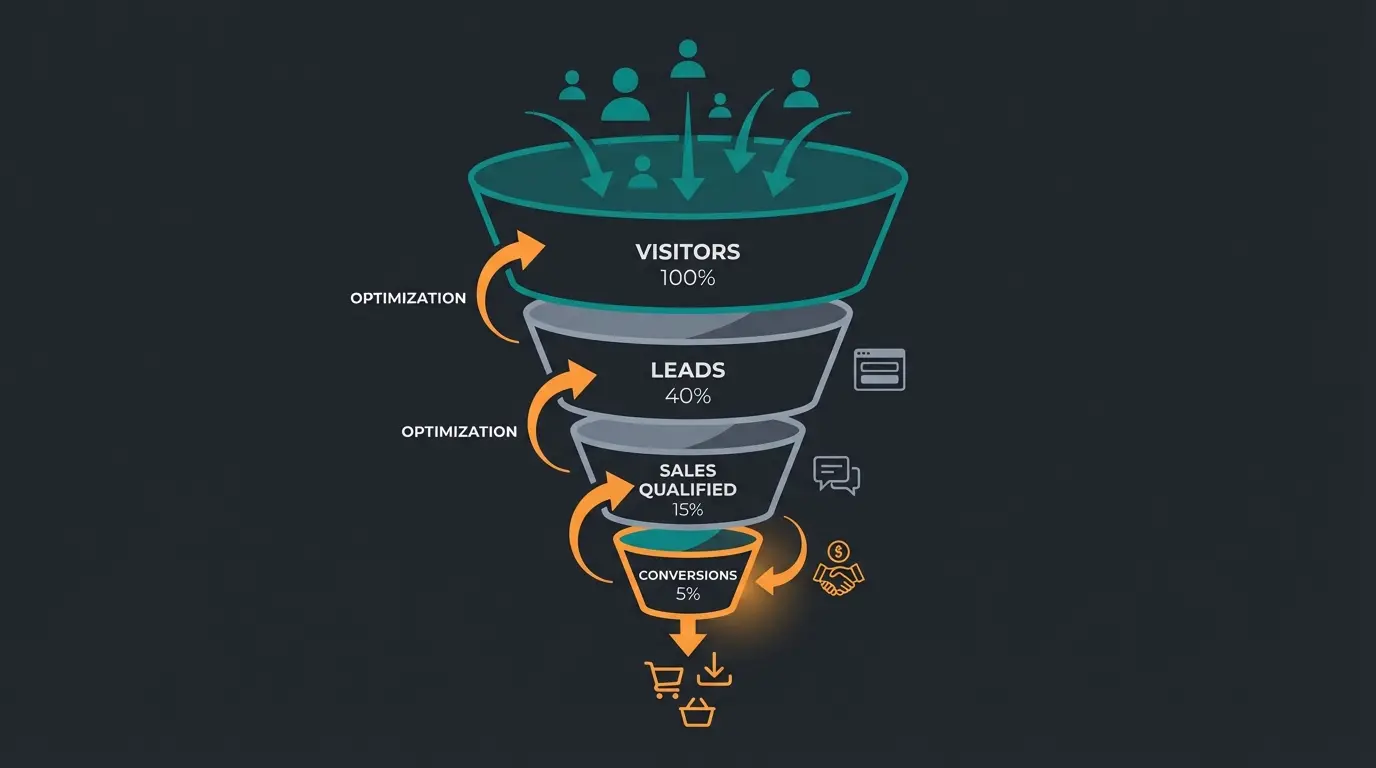
What is ecommerce conversion rate optimization?
Ecommerce conversion rate optimization (CRO) is the systematic process of increasing the percentage of website visitors who complete a desired action, whether that is a purchase, a sign-up, or a demo booking. The formula is simple: (Conversions / Total Visitors) x 100 = Conversion Rate.
If your store gets 10,000 visitors per month and 200 buy something, your conversion rate is 2%. CRO's job is to turn that 2% into 3%, 4%, or higher, without spending a single extra dollar on advertising.
This is why CRO delivers the highest ROI of any ecommerce investment. SEO brings more visitors. Paid ads bring more visitors. CRO makes the visitors you already have more valuable. A store spending $50,000/month on ads with a 2% conversion rate generates the same revenue as a store spending $25,000/month with a 4% conversion rate. Same revenue, half the ad spend.
There is an important distinction most guides skip: macro-conversions vs micro-conversions. A macro-conversion is the end goal (purchase, demo booking). Micro-conversions are the steps along the way: adding to cart, creating an account, signing up for a newsletter, clicking a product recommendation. Optimizing micro-conversions often has a bigger impact than obsessing over the final checkout, because each micro-conversion moves a visitor closer to buying. For Shopware-specific tactics, our Shopware Conversion Optimization Guide covers platform-level implementation.
Average ecommerce conversion rates by industry
Before you optimize, you need a baseline. The global average ecommerce conversion rate sits between 2% and 3%, according to Statista global ecommerce conversion benchmarks. But this number hides massive variation by industry, device, and traffic source.
| Industry | Average CR | Top performers | Key driver |
|---|---|---|---|
| Food & Beverage | 3.0-5.0% | 6-8% | Repeat purchases, low decision complexity |
| Health & Beauty | 2.5-4.0% | 5-7% | Brand loyalty, subscription models |
| Fashion & Apparel | 1.5-2.5% | 3-4% | High return rates offset conversions |
| Electronics | 1.0-2.0% | 2.5-3.5% | High research intent, price comparison |
| Home & Garden | 1.5-2.5% | 3-4% | Seasonal spikes, complex product selection |
| B2B / Industrial | 2.0-5.0% | 7-10% | Higher intent, longer sales cycles |
| Luxury / High-ticket | 0.5-1.5% | 2-3% | Extended consideration phase |
Device matters enormously. Desktop conversion rates typically run 3-4%, while mobile sits at 1.5-2%, according to Baymard Institute cart abandonment research. With mobile traffic now exceeding 60% of total ecommerce visits, this gap represents the single biggest optimization opportunity for most stores.
A critical point: benchmarks are directional, not targets. A 2% conversion rate for a luxury watch store is excellent. A 2% rate for a grocery delivery service is a problem. Context matters more than the number itself. For detailed benchmarks and how to interpret them for your business, see our guides on average ecommerce conversion rate data and online store conversion rate benchmarks.
97-98% of visitors leave without buying
Source: Baymard Institute (2025), based on 49 studies
Desktop converts nearly twice as often as mobile
A single percentage point increase means 50% more revenue from the same traffic
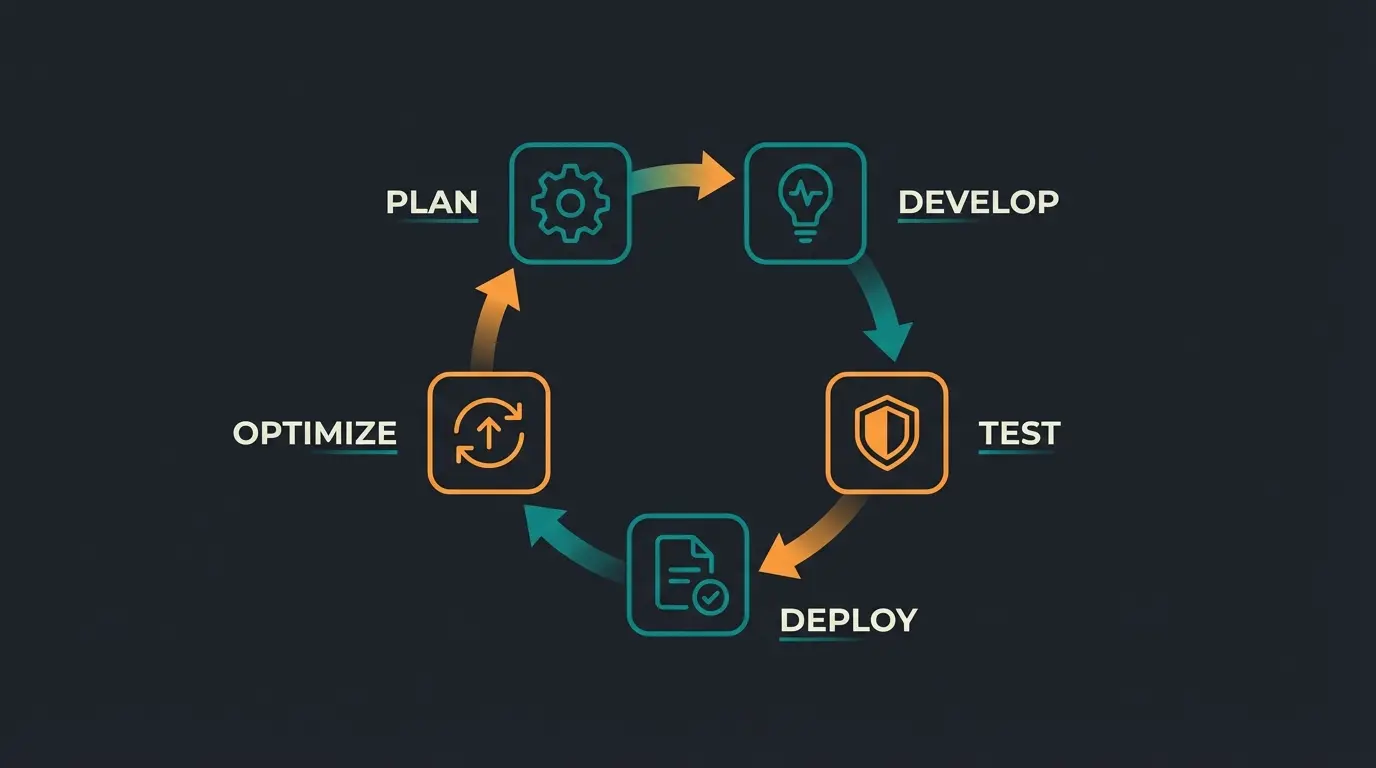
The 5-step CRO process
CRO is not guesswork. It is a structured, repeatable process. Every optimization cycle follows five steps. Skip one and you are gambling, not optimizing.
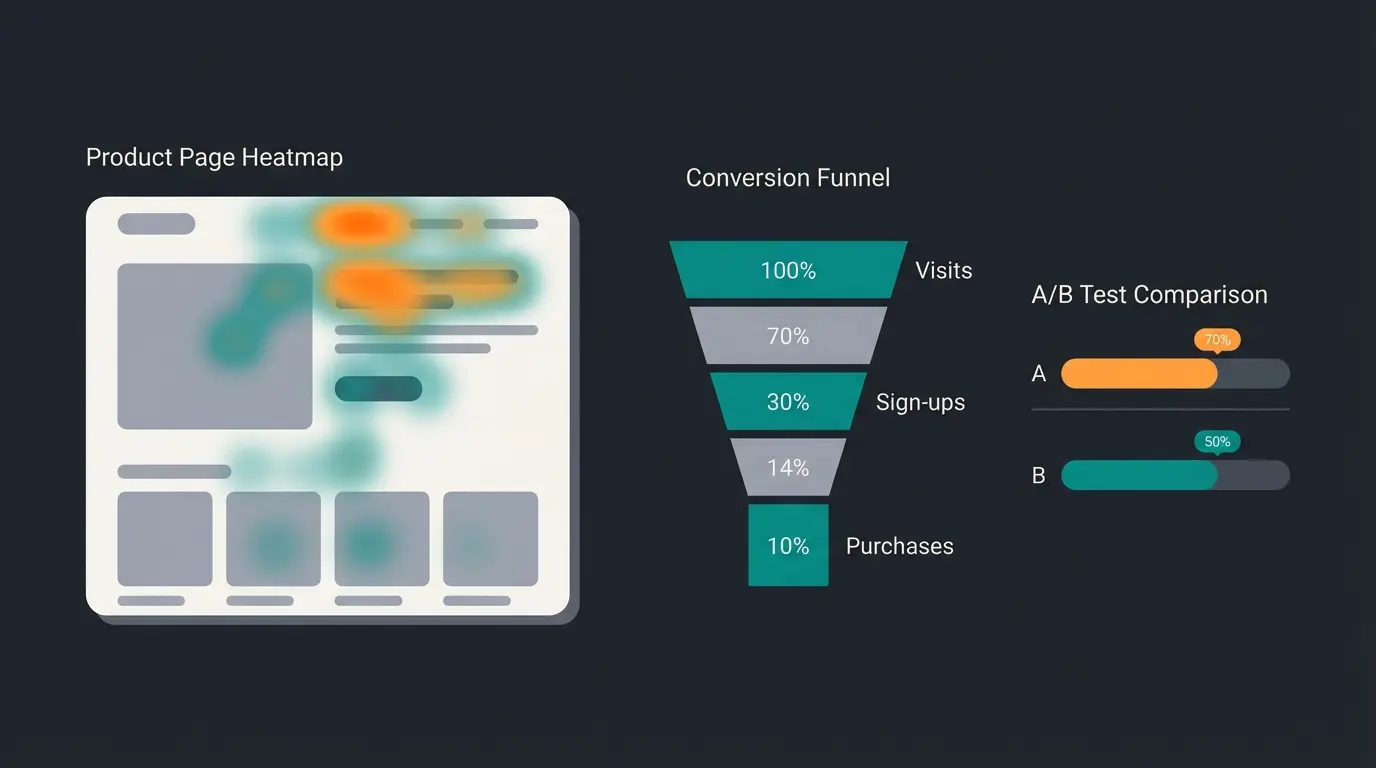
Use GA4 for funnel analysis, heatmaps (Hotjar, Microsoft Clarity) for click patterns, and session recordings to watch real user behavior. Identify WHERE visitors drop off before guessing WHY.
Find the pages with the highest exit rates, the funnel steps with the biggest drop-offs, and the devices or segments that underperform. Focus on the biggest leaks first.
Structure every hypothesis: IF we change [specific element], THEN [measurable outcome] will improve, BECAUSE [user behavior insight]. No hypothesis, no test.
Test one variable at a time. Run until you reach statistical significance (typically 95% confidence, minimum 2-4 weeks). Do not stop tests early because early results look good.
Winner goes live. Loser teaches you something. Document everything. Start the next cycle. CRO is never done because user behavior, competitors, and technology keep changing.
The iterative nature is what most teams get wrong. They run one round of tests, implement the winners, and move on. But your competitors are optimizing too. The moment you stop testing, you start falling behind. The best ecommerce teams run 2-4 tests per month continuously. For a deep dive into testing methodology, our guide on A/B testing in your online store covers setup, sample sizes, and statistical significance.
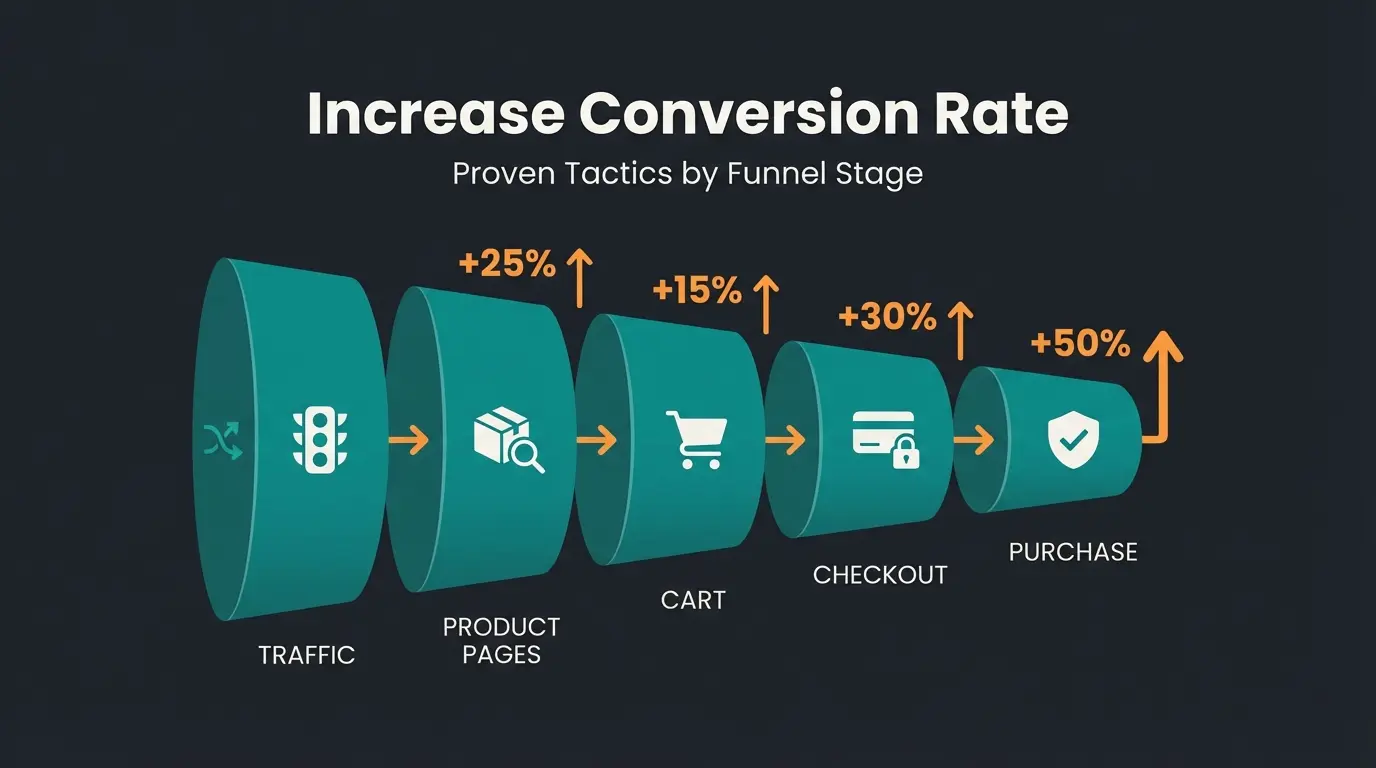
The most impactful CRO strategies for online stores
After optimizing conversion funnels for 25+ ecommerce stores, these are the strategies that consistently deliver the biggest lifts. Ranked by typical impact.
Product page optimization
The product page is where buying decisions happen. Yet most stores treat it as a data sheet. High-performing product pages combine four elements: high-quality images (minimum 5 angles plus video), benefit-driven descriptions (not just specifications), social proof (reviews, ratings, user photos), and urgency signals (stock levels, delivery estimates). For Shopware stores specifically, our guide on how to optimize your Shopware product pages covers plugin recommendations and template modifications.
Checkout simplification
Baymard Institute research shows that 18% of cart abandonments happen because the checkout process is too long or complicated. The fixes are straightforward: offer guest checkout (forcing account creation kills 24% of conversions), reduce form fields to the minimum, show a progress indicator, and display total costs including shipping before the final step. No surprises. Our checkout optimization guide walks through the implementation step by step.
Trust elements
Trust is the invisible conversion killer. Shoppers who do not trust your store will not buy, no matter how good your product pages look. The essentials: security badges (SSL, payment provider logos), customer reviews with verified purchase tags, clear return and shipping policies visible before checkout, and real contact information (not just a form). Adding trust elements and badges to checkout pages typically lifts conversion rates by 5-15%.
Mobile optimization
With 60%+ of traffic coming from mobile devices and conversion rates sitting at half the desktop rate, mobile optimization is not optional. Focus on: thumb-friendly CTA buttons (minimum 48px height), fast load times (under 3 seconds or you lose 53% of visitors), simplified navigation with sticky add-to-cart buttons, and mobile-specific payment options (Apple Pay, Google Pay) that skip form-filling entirely. For Shopware-specific mobile tactics, see our Shopware Mobile Optimization guide.
Upselling and cross-selling
Increasing average order value is CRO that does not require more traffic or higher conversion rates. Bundle recommendations ("frequently bought together"), tiered pricing ("buy 3, save 15%"), and post-add-to-cart suggestions are proven tactics. The key is relevance: generic recommendations annoy, personalized ones convert. For cross-sell implementation, our Shopware Cross Selling guide covers configuration and best practices. Our guide on upselling strategies covers the psychology and implementation.
For a comprehensive breakdown of all tactics with implementation checklists, see our guide on how to increase your conversion rate.
Essential CRO tools comparison
You do not need expensive tools to start optimizing. Here is what each category of CRO tool does, what it costs, and when you need it.
| Category | Free options | Paid options | What it does | When you need it |
|---|---|---|---|---|
| Heatmaps & Recordings | Microsoft Clarity | Hotjar ($39-$213/mo), FullStory (custom) | Shows where users click, scroll, and rage-click. Session recordings reveal real user frustration. | Day 1. Start with Clarity (free, unlimited). |
| A/B Testing | Google Optimize (discontinued), PostHog (free tier) | VWO ($199+/mo), AB Tasty (custom), Optimizely (enterprise) | Tests variations of pages, CTAs, layouts against each other with statistical rigor. | When you have 10,000+ monthly visitors (below this, tests take too long for significance). |
| Analytics | GA4, Matomo (self-hosted) | Mixpanel ($28+/mo), Amplitude (custom) | Tracks funnel completion, drop-off points, and conversion paths across sessions. | Day 1. GA4 is non-negotiable. |
| User Feedback | Hotjar (free tier surveys) | Qualaroo ($69+/mo), UserTesting ($49+/session) | Collects qualitative data: why users did not buy, what confused them, what they wanted. | When quantitative data shows a problem but does not explain why. |
| AI Product Consultation | None (standard tools lack conversational intelligence) | Qualimero, Nosto, Clerk.io | Guides visitors to the right product through conversational interaction, replacing static filters. | When you sell complex or configurable products where standard search and filters fail. |
Start with the free stack: Microsoft Clarity for heatmaps and session recordings, GA4 for funnel analytics. These two tools alone give you 80% of the insights you need. Add paid A/B testing only when your traffic supports statistically significant tests (typically 10,000+ monthly visitors).
AI-powered CRO: the future of ecommerce optimization
Traditional CRO optimizes what is already on the page: button colors, headline copy, image placement. AI-powered CRO adds a new dimension: it changes the experience in real time based on who the visitor is and what they need.
Three AI applications are transforming ecommerce conversion rates right now.
AI-powered product consultation is the biggest lever for stores with complex or configurable products. Instead of forcing visitors to navigate filters ("What thread size? What material? What pressure rating?"), an AI employee asks what problem they are trying to solve and recommends the right product with an explanation of why it fits. Our clients see 3-7x higher conversion rates from visitors who engage with AI consultation compared to standard browse-and-filter behavior.
Automated personalization adapts the shopping experience based on visitor behavior, purchase history, and segment data. This goes beyond "customers also bought" widgets. True personalization in your online store means different homepage layouts, product orderings, and messaging for different visitor segments, all running automatically.
Predictive analytics uses machine learning to identify which visitors are most likely to convert, which are about to abandon, and what intervention will keep them engaged. Exit-intent popups were the primitive version. AI-driven interventions are contextual: offering a size guide to someone who has been comparing two sizes for three minutes, or surfacing a warranty option to someone viewing a high-ticket item for the second time.
Qualimero's AI employees deliver real-time product consultation that turns browsers into buyers. Our clients see +35% cart value and 7x higher conversion rates. Works on Shopware, Shopify, WooCommerce, and any platform with an API.
Book a demoCommon CRO mistakes to avoid
Five mistakes that kill CRO programs before they deliver results.
- Testing too many variables at once. If you change the headline, image, and CTA simultaneously, you cannot know which change caused the result. Test one variable per experiment. Fix: use sequential A/B tests, not multivariate tests (unless you have massive traffic).
- Stopping tests too early. A test showing +20% after two days might show +2% after two weeks. Early results are noise, not signal. Fix: set your minimum sample size before launching and do not peek until you reach it.
- Ignoring mobile users. Optimizing desktop and assuming mobile will follow is the most expensive CRO mistake. Mobile users have different behavior patterns, patience levels, and interaction methods. Fix: run separate analyses and tests for mobile.
- Copying competitors blindly. What works for Amazon does not work for a 500-SKU specialty store. Your audience, price points, and purchase patterns are unique. Fix: use competitor analysis for inspiration, not imitation. Test everything on your audience.
- Optimizing for the wrong goal. Optimizing add-to-cart rate while ignoring checkout completion is like filling a bucket with a hole in it. Fix: map your entire funnel and optimize the step with the biggest drop-off first.
FAQ
A good ecommerce conversion rate depends on your industry. The global average is 2-3%. Food and beverage stores average 3-5%, while electronics and luxury sit at 1-2%. A rate above your industry average is "good." A rate that improves month over month is better.
Individual A/B tests need 2-4 weeks minimum to reach statistical significance, depending on your traffic volume. A structured CRO program typically shows measurable revenue impact within 2-3 months. The compound effect of continuous optimization grows over time.
You can start for free with Microsoft Clarity (heatmaps) and GA4 (analytics). Paid A/B testing tools start at $199/month (VWO). Hiring a CRO agency costs $3,000-$15,000/month. AI-powered product consultation tools like Qualimero are subscription-based. The ROI typically exceeds the cost within the first month.
Both serve different purposes. SEO increases traffic volume, CRO increases revenue per visitor. If you already have traffic but low conversion rates, CRO delivers faster ROI. If you have minimal traffic, SEO comes first. The ideal approach: run CRO and SEO simultaneously, since CRO makes every SEO visitor more valuable.
Microsoft Clarity (heatmaps, session recordings, unlimited and free), Google Analytics 4 (funnel analysis, conversion tracking), and Hotjar's free tier (limited heatmaps and surveys). This stack covers 80% of what most ecommerce stores need to identify and fix conversion problems.
See how AI-powered product consultation works on your product catalog. Our team will show you exactly where your funnel leaks and how to fix it.
Talk to our team
Lasse is CEO and co-founder of Qualimero. After completing his MBA at WHU and scaling a company to seven-figure revenue, he founded Qualimero to build AI-powered digital employees for e-commerce. His focus: helping businesses measurably improve customer interaction through intelligent automation.